Free
Math
Lesson Plan
Grade 2
No ratings yet
Grade 2 Math Lesson Plan: Data & Graphs — 4 Lessons with Timings
About This Resource
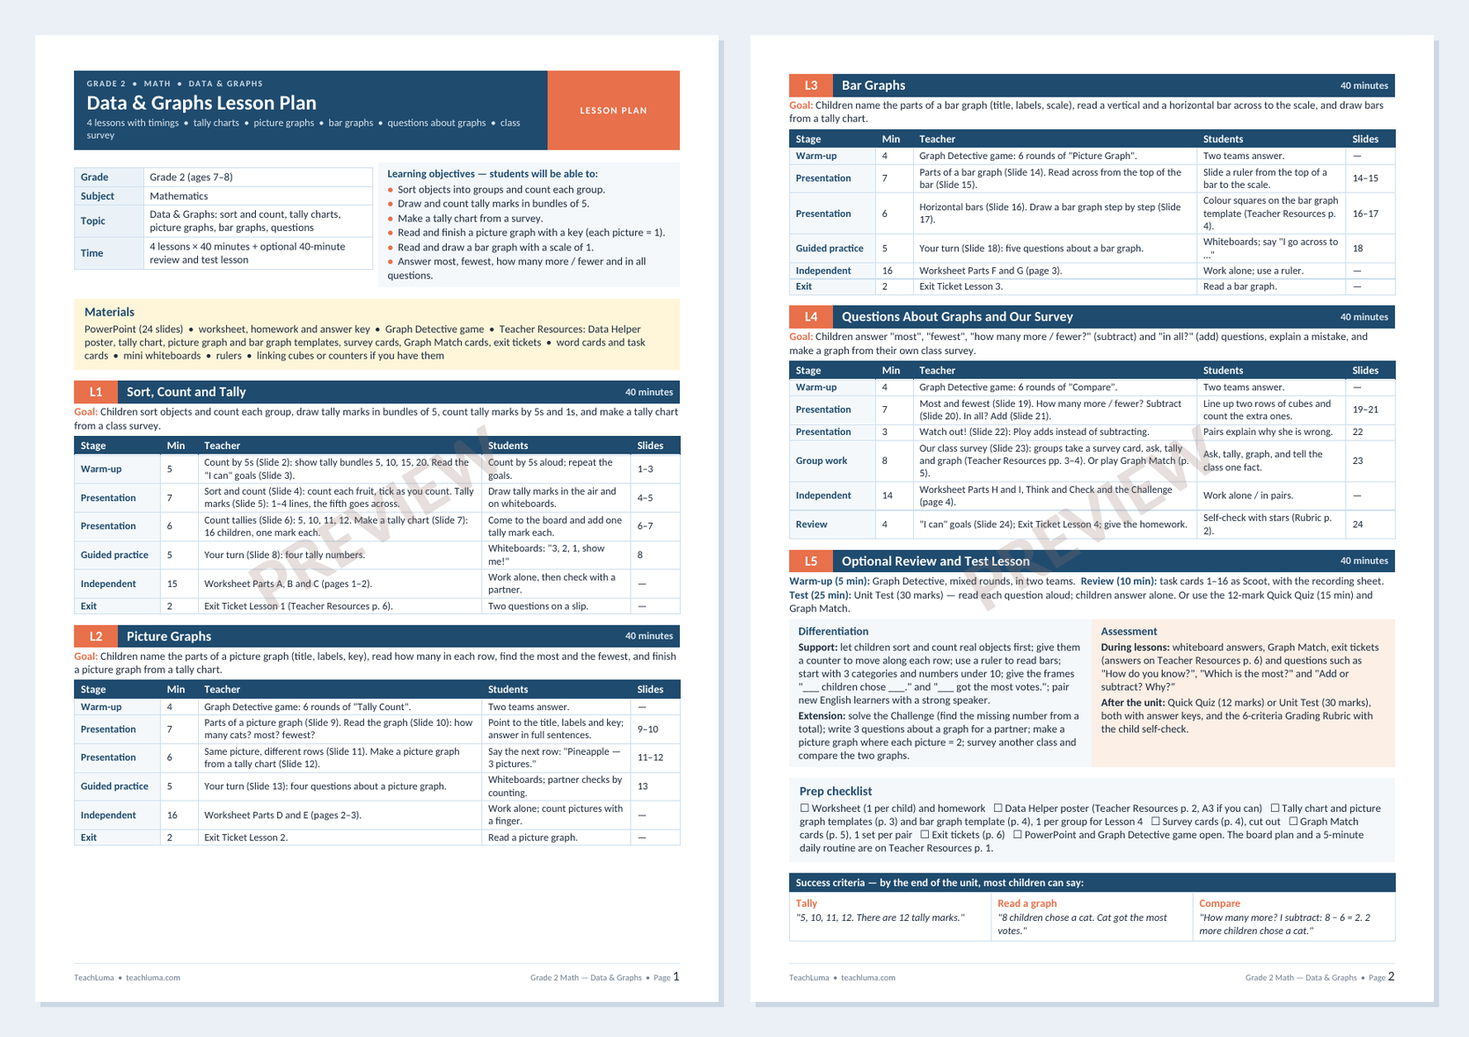
A 2-page, minute-by-minute plan for four 40-minute Grade 2 lessons on data and graphs — sort, count and tally; picture graphs; bar graphs; and questions about graphs with a class survey — plus a review and test lesson, differentiation, assessment, prep checklist and success criteria.
Overview
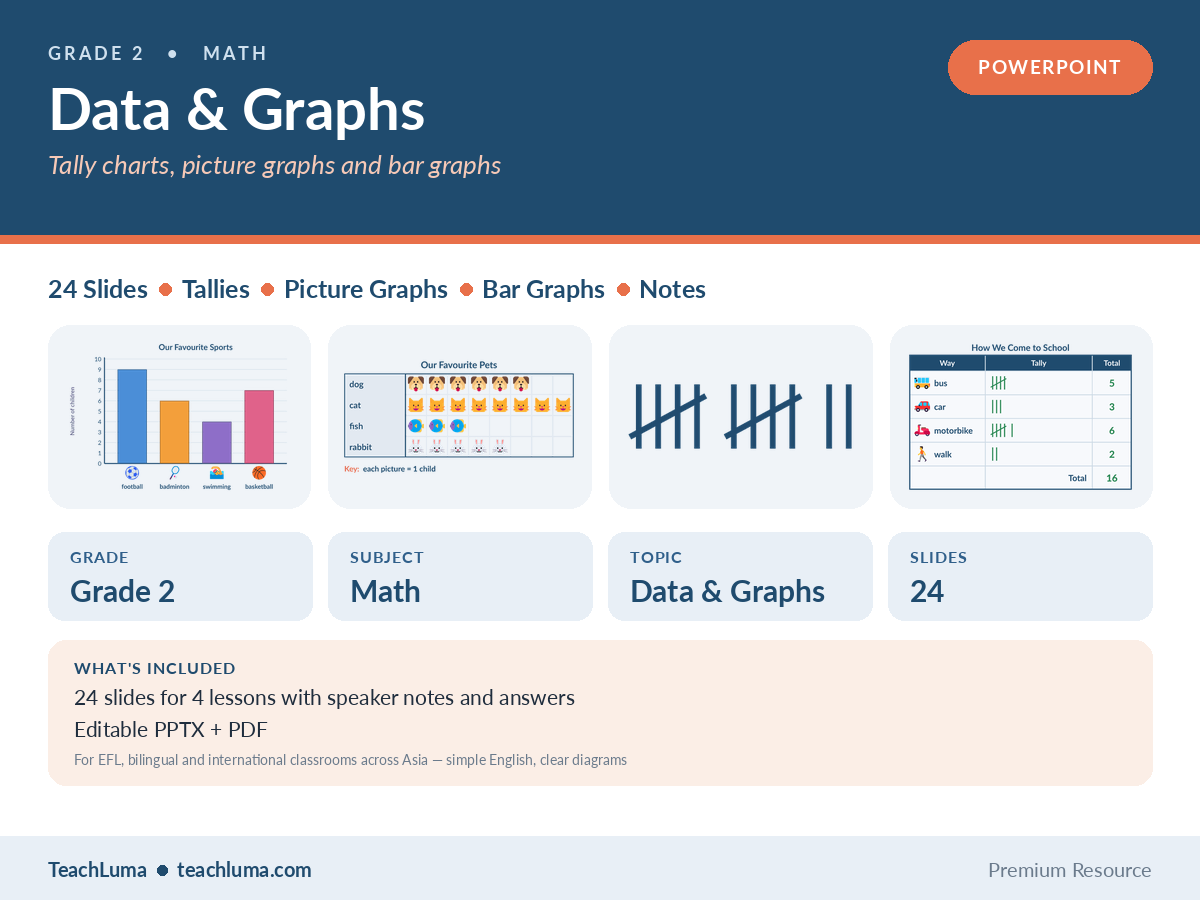
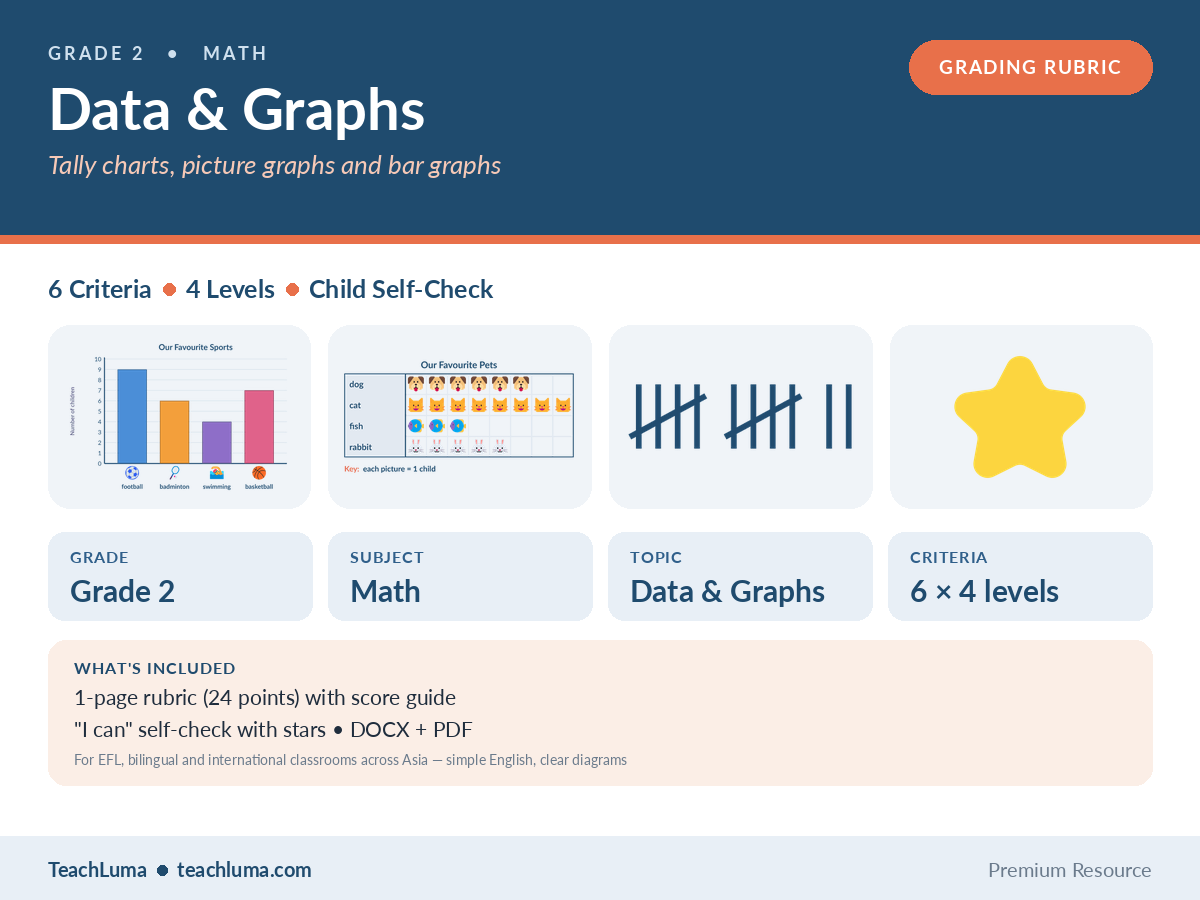
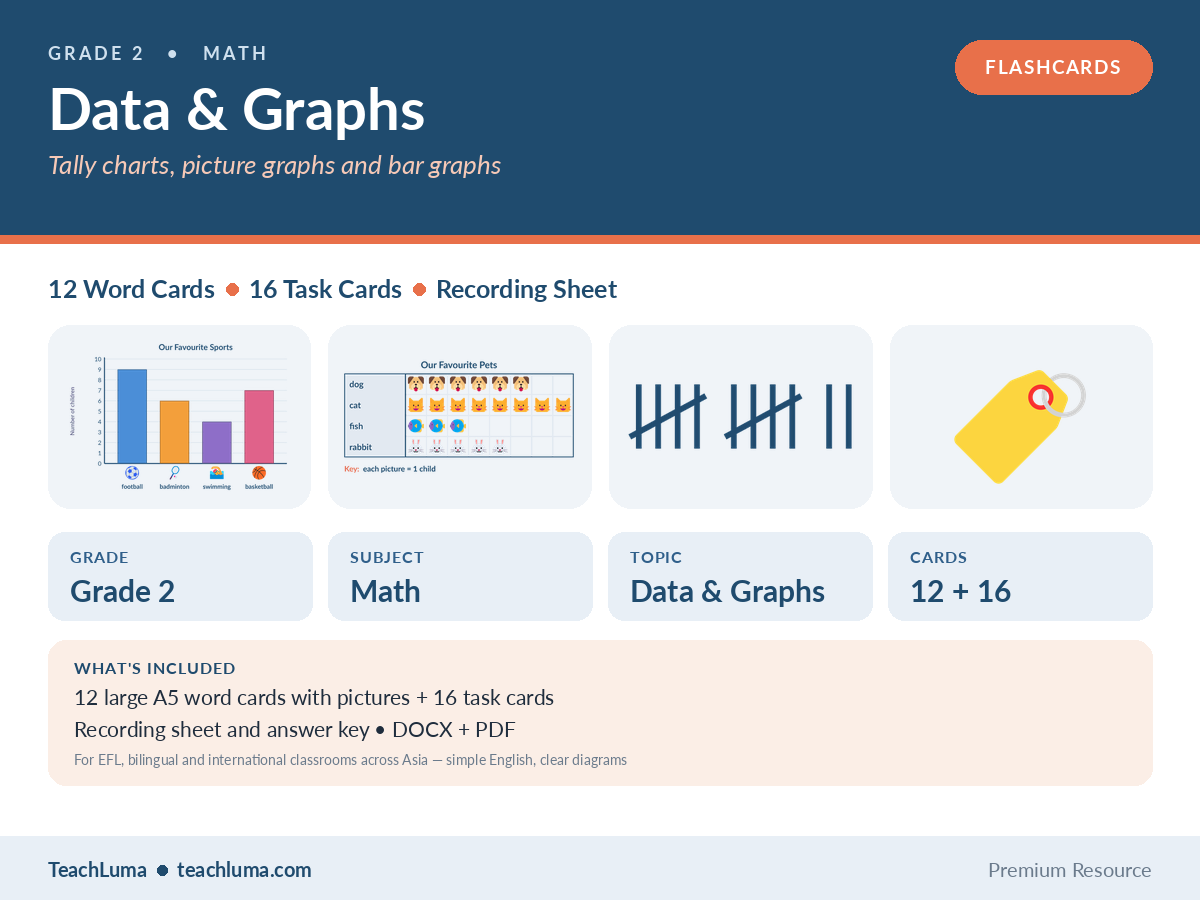
This pack teaches Grade 2 children to collect, show and read data. Lesson 1 sorts and counts objects, draws tally marks in bundles of 5 and makes a tally chart from a class survey (how we come to school: bus, car, motorbike, walk). Lesson 2 reads picture graphs — title, labels and key (each picture = 1) — finds the most and the fewest, and finishes a picture graph from a tally chart. Lesson 3 reads vertical and horizontal bar graphs with a scale of 1 and draws bars from a tally chart. Lesson 4 answers questions about graphs — most, fewest, how many more / fewer (subtract) and in all (add) — and ends with the class making its own survey and graph. Every graph uses 3 or 4 groups and numbers up to 12. Each one was drawn from the same data as its questions, and every answer, tally mark and bar was checked by computer. The contexts are familiar in Asian classrooms (fruit, pets, sports, weather, motorbikes and buses), and the English is short and repeated, for ESL / EFL learners. This listing covers the Lesson Plan only.
Resource Details
- Subject
- Math
- Topic
- Data & Graphs
- Category
- Data & Graphs
- File Type
- PDF
- File Size
- 56.7 KB
- Published
- 12 Oct 2026
- Downloads
- 0
Looking for something different? Request a Resource.