Skip to content
Preview
Members Only Math Assessment Grade 2
No ratings yet

Grade 2 Math Unit Test: Data & Graphs (30 Marks)

About This Resource

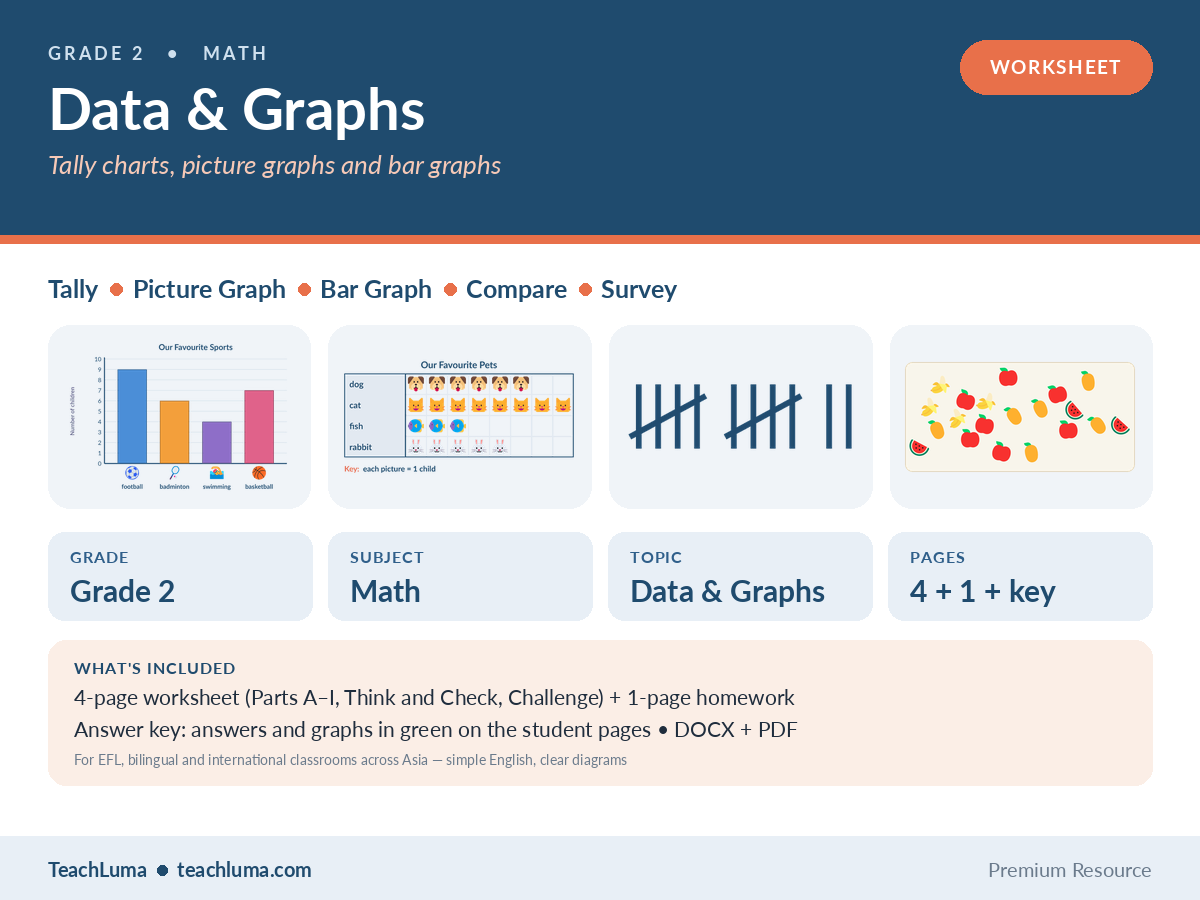
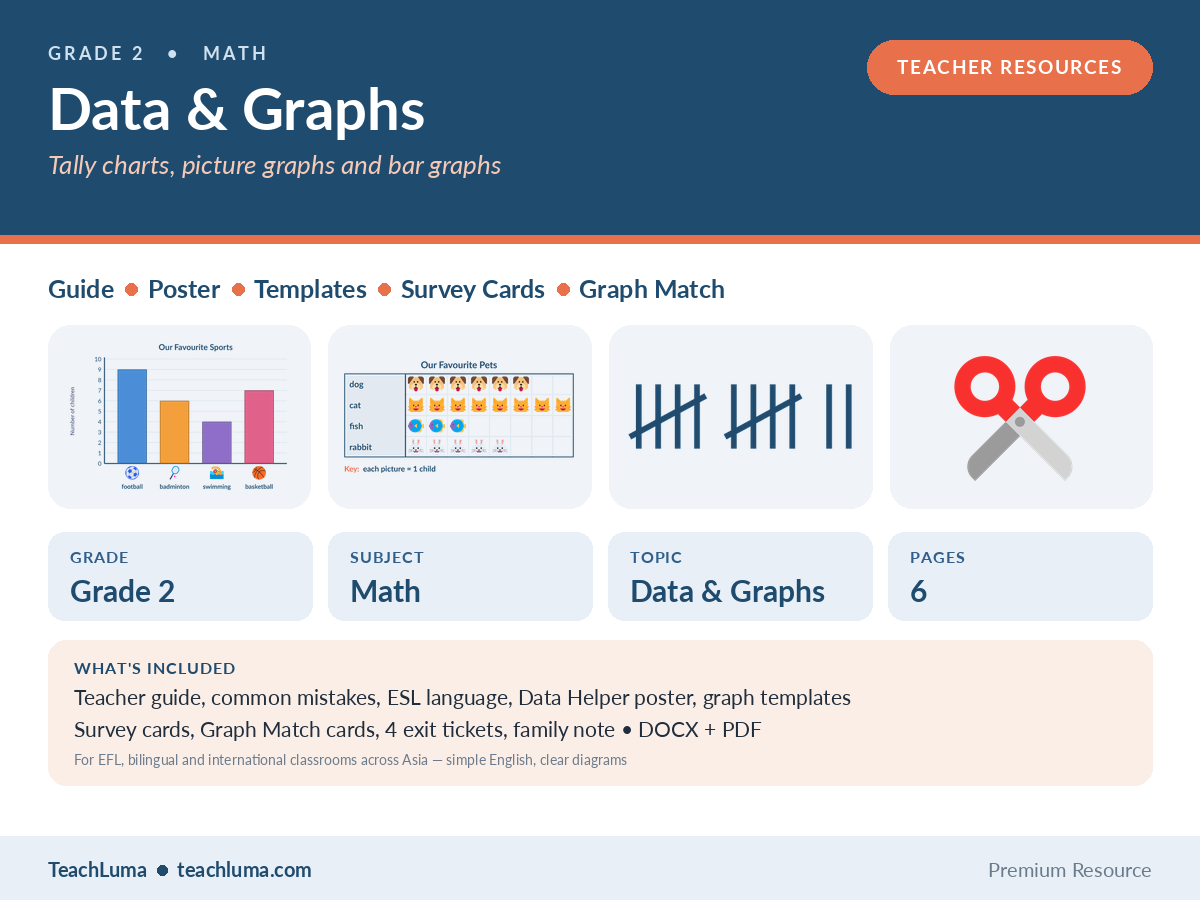
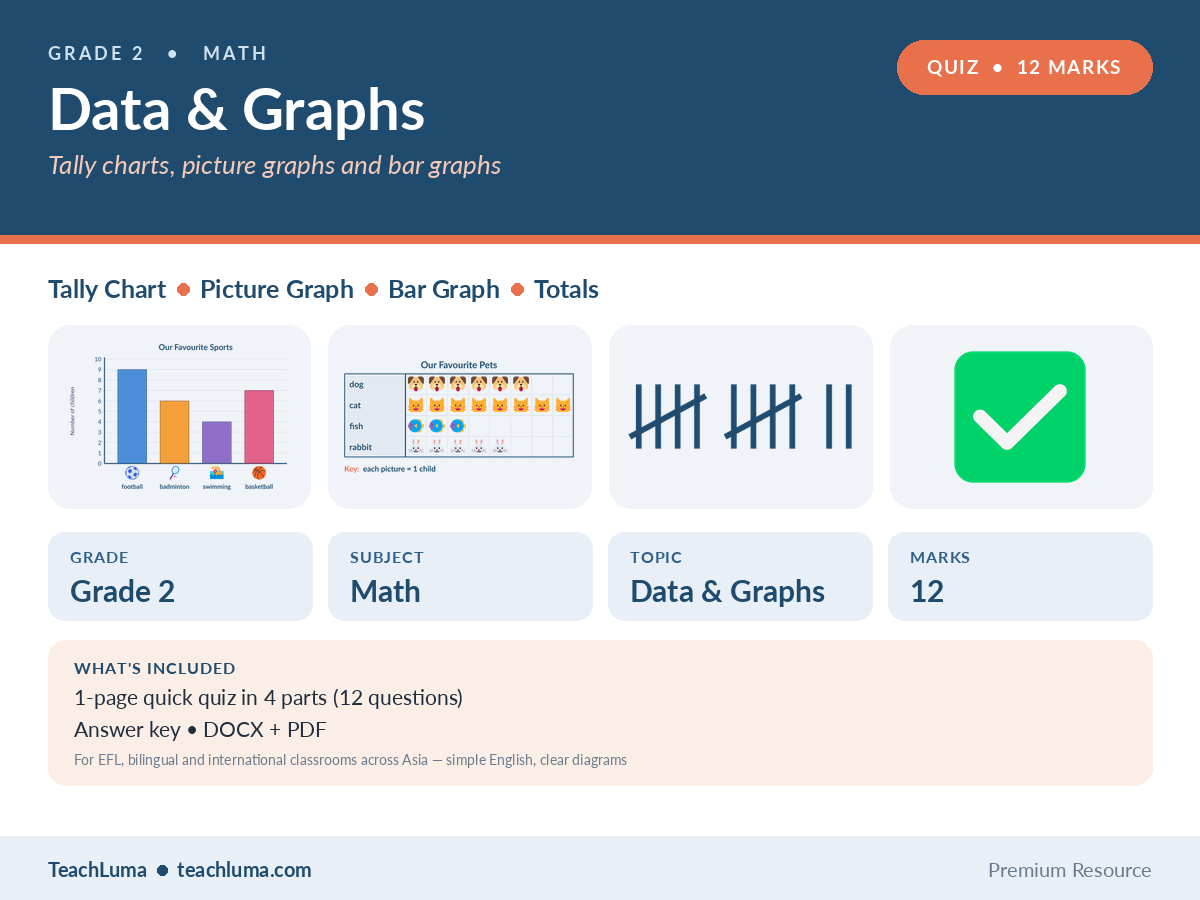
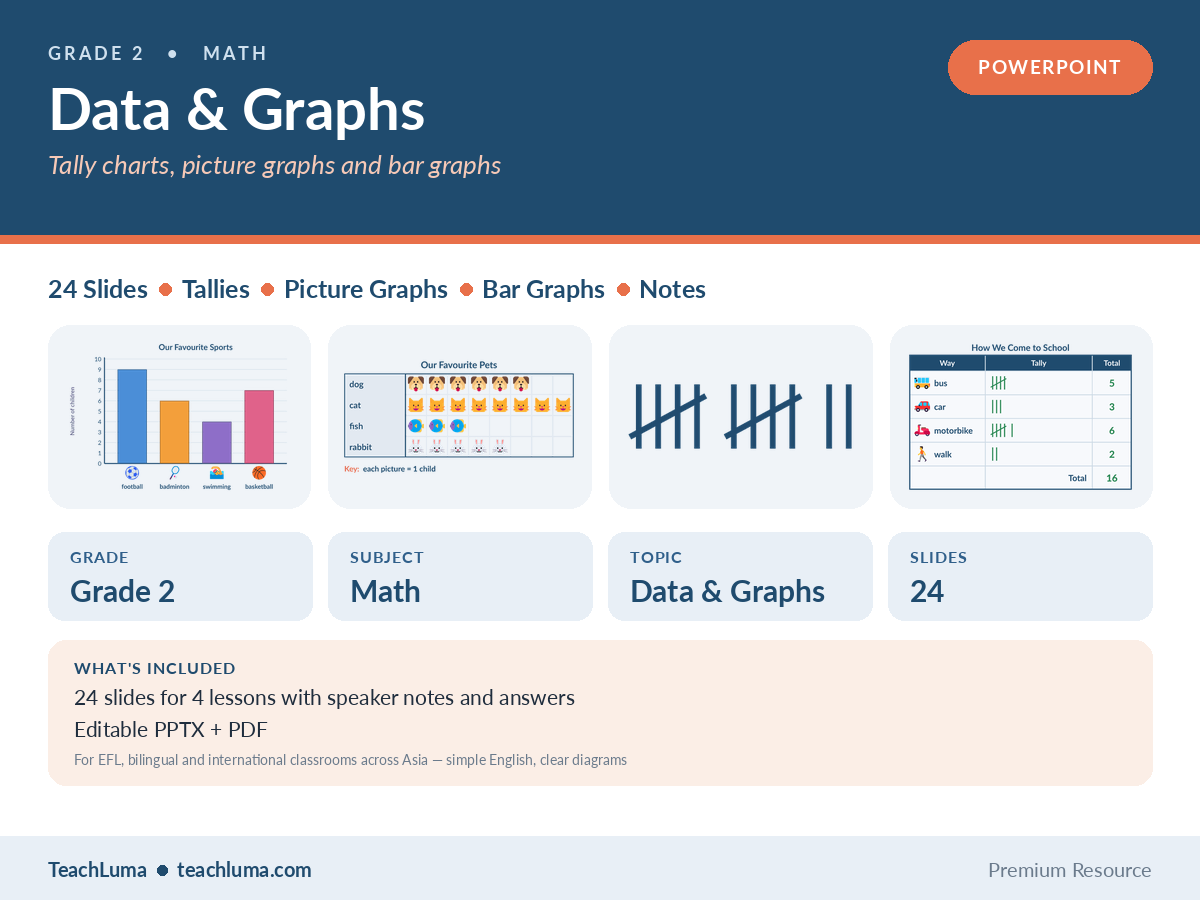
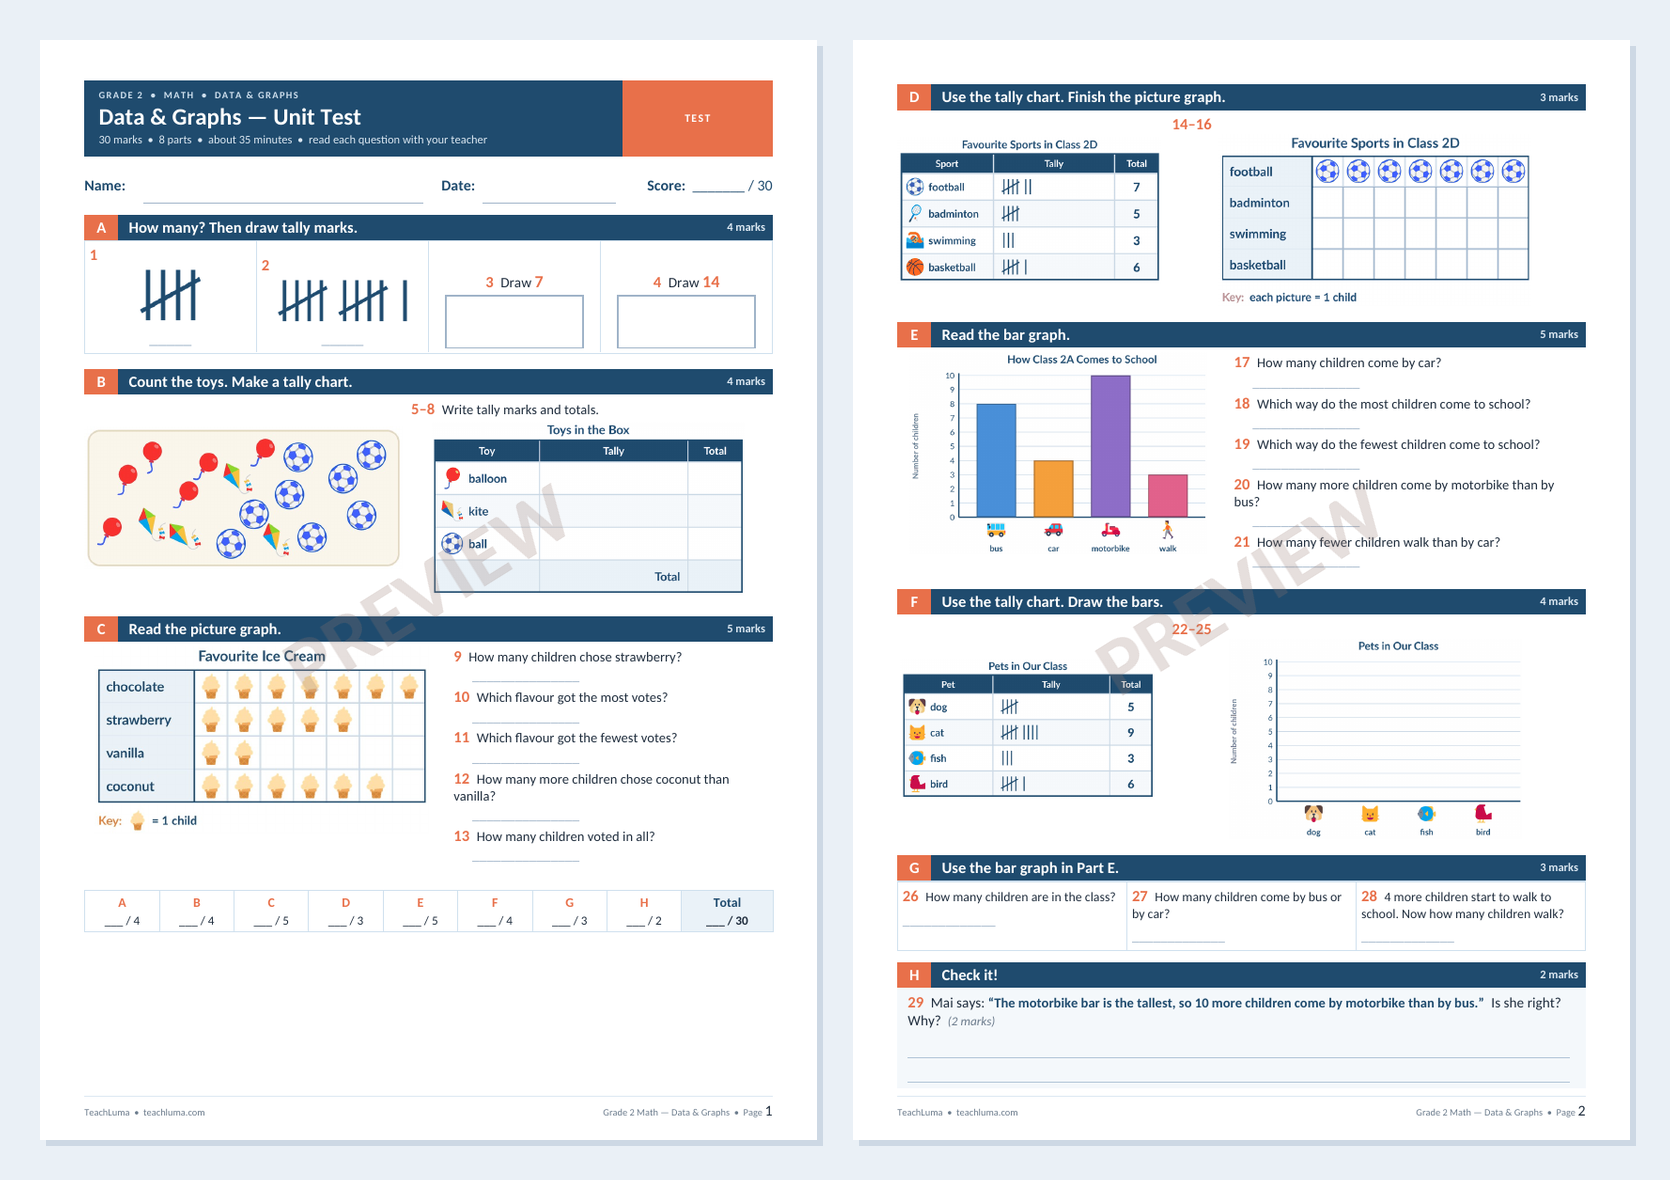
A 2-page, 30-mark unit test in 8 parts — tally marks, make a tally chart, read a picture graph, finish a picture graph, read a bar graph, draw a bar graph, graph problems and Check it! — with a score strip, performance bands and a full answer key.

Overview

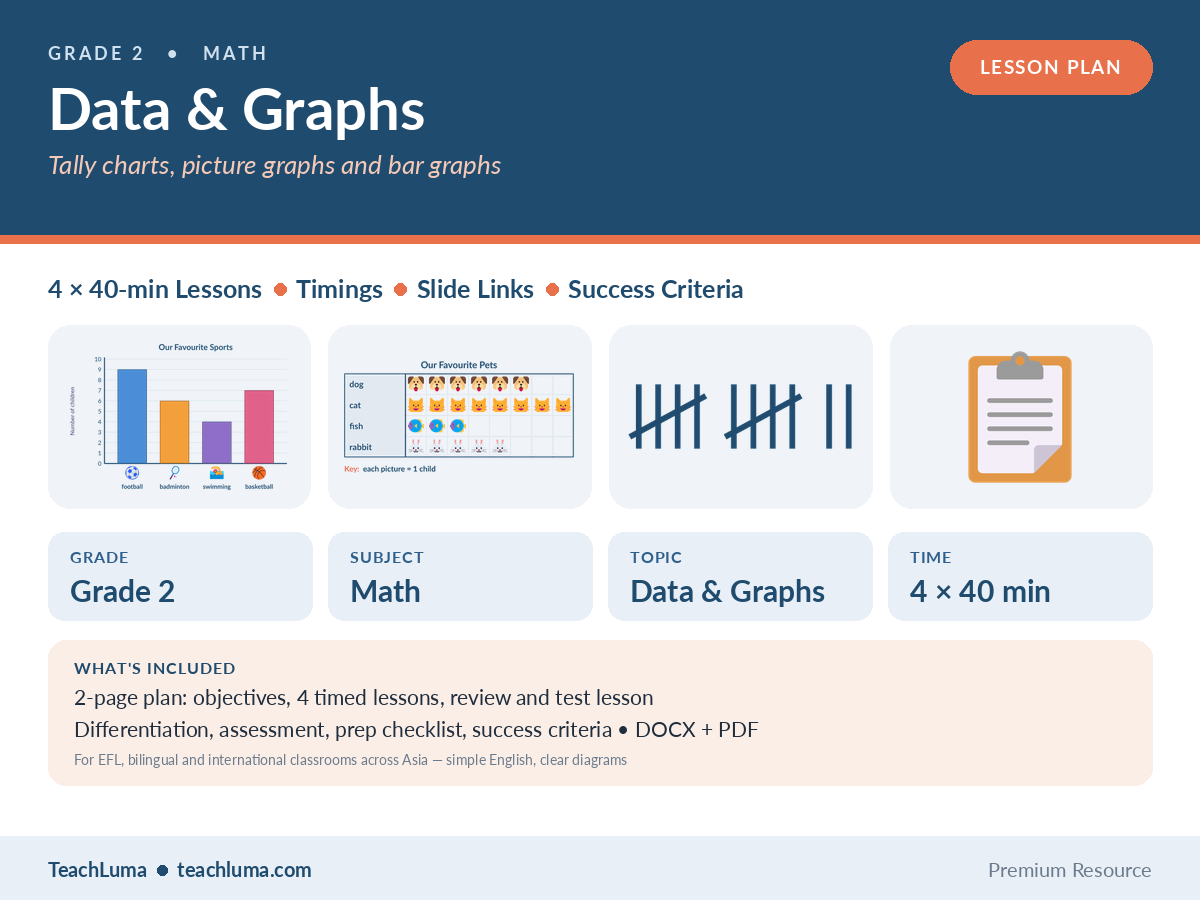
This pack teaches Grade 2 children to collect, show and read data. Lesson 1 sorts and counts objects, draws tally marks in bundles of 5 and makes a tally chart from a class survey (how we come to school: bus, car, motorbike, walk). Lesson 2 reads picture graphs — title, labels and key (each picture = 1) — finds the most and the fewest, and finishes a picture graph from a tally chart. Lesson 3 reads vertical and horizontal bar graphs with a scale of 1 and draws bars from a tally chart. Lesson 4 answers questions about graphs — most, fewest, how many more / fewer (subtract) and in all (add) — and ends with the class making its own survey and graph. Every graph uses 3 or 4 groups and numbers up to 12. Each one was drawn from the same data as its questions, and every answer, tally mark and bar was checked by computer. The contexts are familiar in Asian classrooms (fruit, pets, sports, weather, motorbikes and buses), and the English is short and repeated, for ESL / EFL learners. This listing covers the Assessment only.

Resource Details

Subject
Math
Topic
Data & Graphs
Category
Data & Graphs
File Type
PDF
File Size
294 KB
Published
12 Oct 2026
Downloads
0

Members Only

Upgrade to Teacher Pro (from ฿199/month) to download this resource.

Share:

Looking for something different? Request a Resource.

Question Types & Suggested Use

30 marks in 8 parts (question 29 is worth 2 marks), with a score strip, performance bands, marking notes and a complete, numbering-matched answer key.

Skills Assessed

  • Sort objects into groups and count each group.
  • Draw tally marks in bundles of 5 and count them by 5s and 1s.
  • Make a tally chart from a survey and write the totals.
  • Read a picture graph with a key (each picture = 1) and finish one from a tally chart.
  • Read vertical and horizontal bar graphs with a scale of 1 and draw bars from a tally chart.
  • Find the most and the fewest on a graph.
  • Answer "how many more / fewer?" by subtracting and "in all?" by adding.

How to Administer

  • Use the test at the end of the unit (optional Lesson 5). Read each question aloud; children answer alone. Mark with the answer key and fill in the score strip on page 1.

Differentiation

Support: Let children sort and count real objects first and tick each one as they count. Give them a counter to move along each row of a picture graph and a ruler to read bars. Start with 3 groups and numbers under 10. Keep the Data Helper poster on the desk. Give sentence frames ("___ children chose ." " got the most votes." "___ more children chose ___ than ___."). Pair a child who is new to English with a partner who models the sentences.
Extension: Solve the worksheet Challenge (find a missing number from a total), write 3 questions about a graph for a partner, make a picture graph where each picture = 2, or survey another class and compare the two graphs. Fast finishers can play Graph Detective (Compare mode).

Follow-Up Activities

  • Use the performance bands in the answer key to make small groups for reteaching.
  • Part H shows quickly which children think the tallest bar is the answer to "how many more?".

Teacher Tips

Collect real data from your own class before you show any printed graph. Keep one class survey (for example "How do you come to school?") on the board all week and show it as a tally chart on Day 1, a picture graph on Day 2 and a bar graph on Day 3. Children then see that all three show the SAME numbers. Two habits stop most mistakes: say "the fifth line goes across" every time children draw tally marks, and read bars with a ruler from the top of the bar across to the scale. Before every question, ask "Add or subtract?" — "how many more?" means subtract (8 − 6 = 2), not add.

What's Included

  • Unit test, 2 pages, 8 parts, 30 marks, score strip (DOCX + PDF)
  • Answer key with marking notes and performance bands, 2 pages (DOCX + PDF)

Additional Files

  • Grade 2 Math Unit Test: Data & Graphs (30 Marks) (DOCX)
  • Answer Key (PDF)

Teacher Reviews

No ratings yet

Be the first teacher to review this resource.

Sign in to review this resource.

Related Resources

Advertisement