Skip to content
Preview
Free Math Flashcards Grade 3
No ratings yet

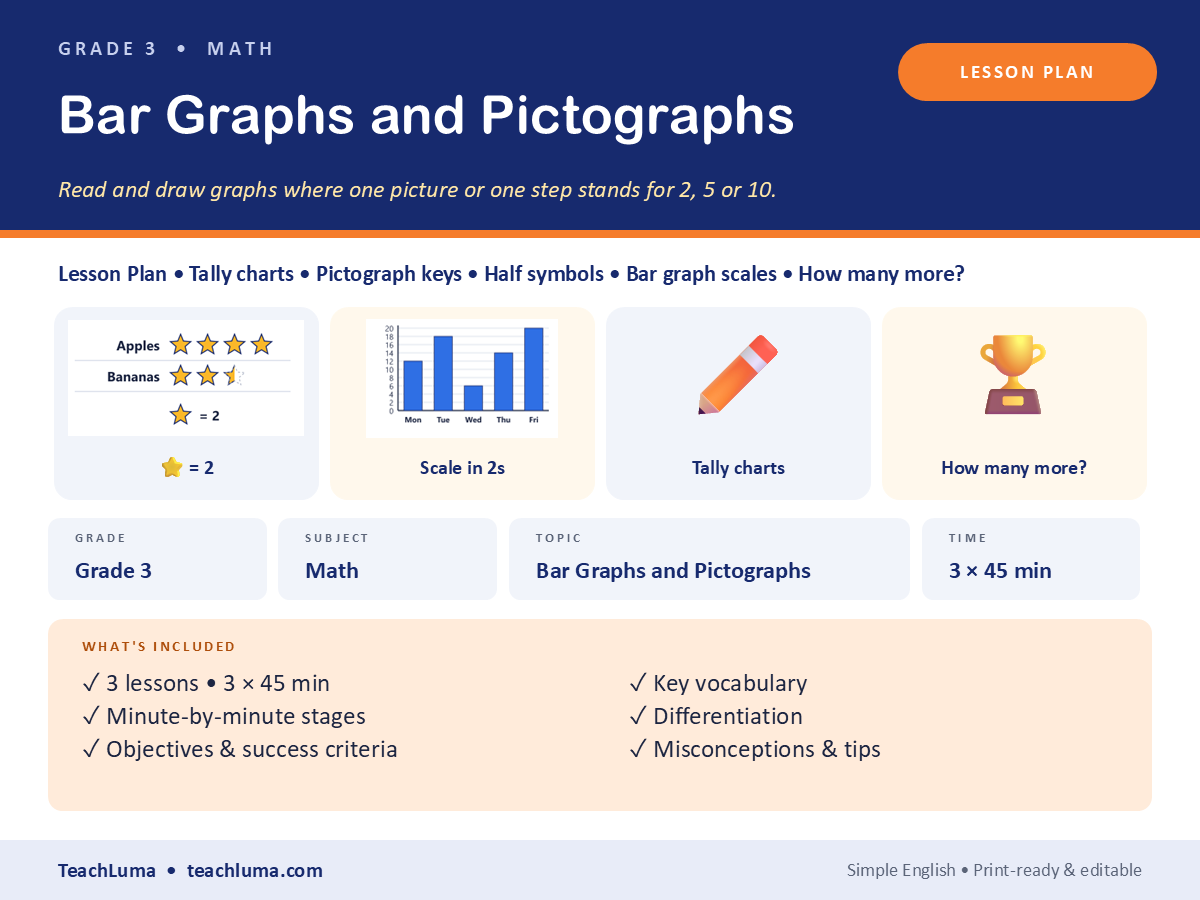
Grade 3 Math Flashcards: Bar Graphs and Pictographs with Scales

About This Resource

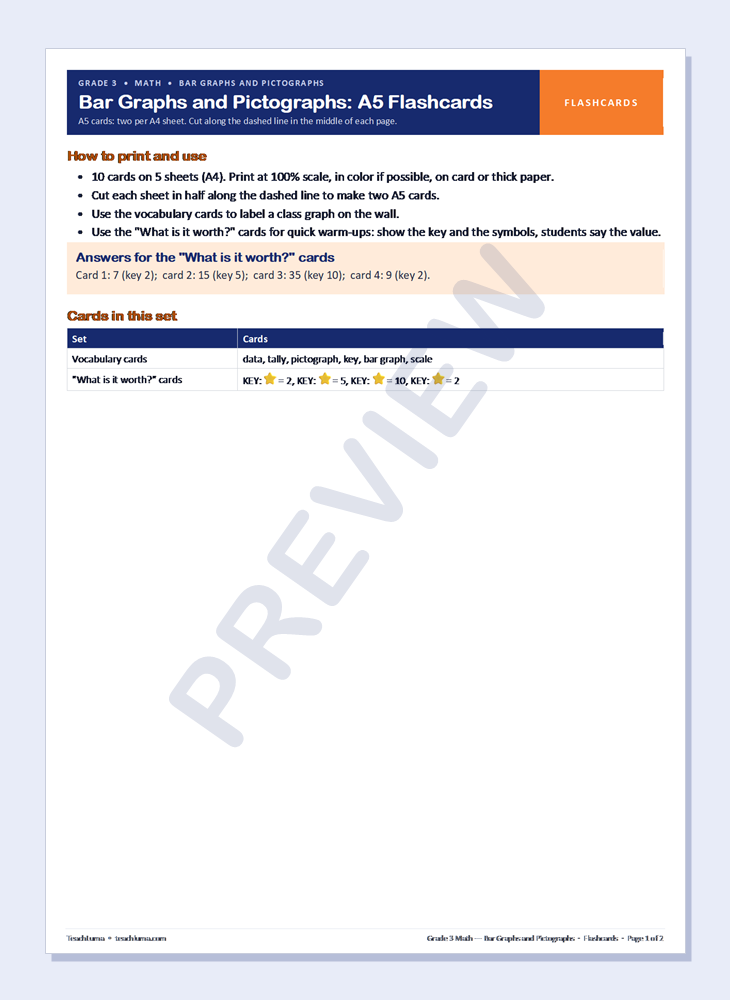
6 pages of printable cut-out cards (vocabulary cards; "what is it worth?" cards) for matching, sorting and word-wall display.

Resource Details

Subject
Math
Topic
Bar Graphs and Pictographs with Scales
Category
Data & Graphs
File Type
PDF
File Size
4.2 MB
Published
18 Oct 2026
Downloads
0
Download

Free download — no account required.

Teaching this in class? Try our free Random Name Picker & Timer.

Share:

Looking for something different? Request a Resource.


How to Present

  • Print on card if possible, cut along the dashed lines.
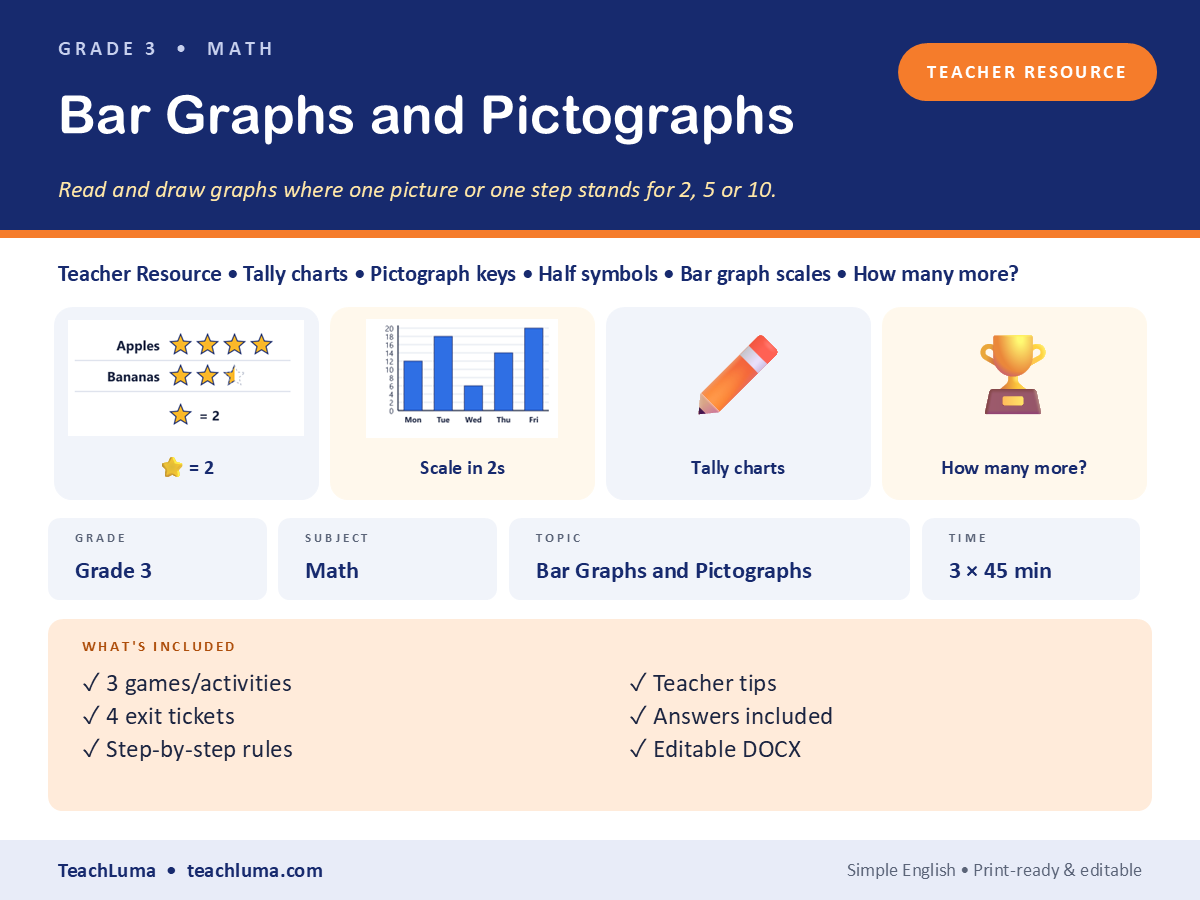
  • Use for matching, sorting, snap and memory games (see the Teacher Resources).
  • Display on the word wall during the unit.

Teacher Tips

Make graphs about real class data — students care more about the answers. Teach "key first, then count" as a routine.

Learning Objectives

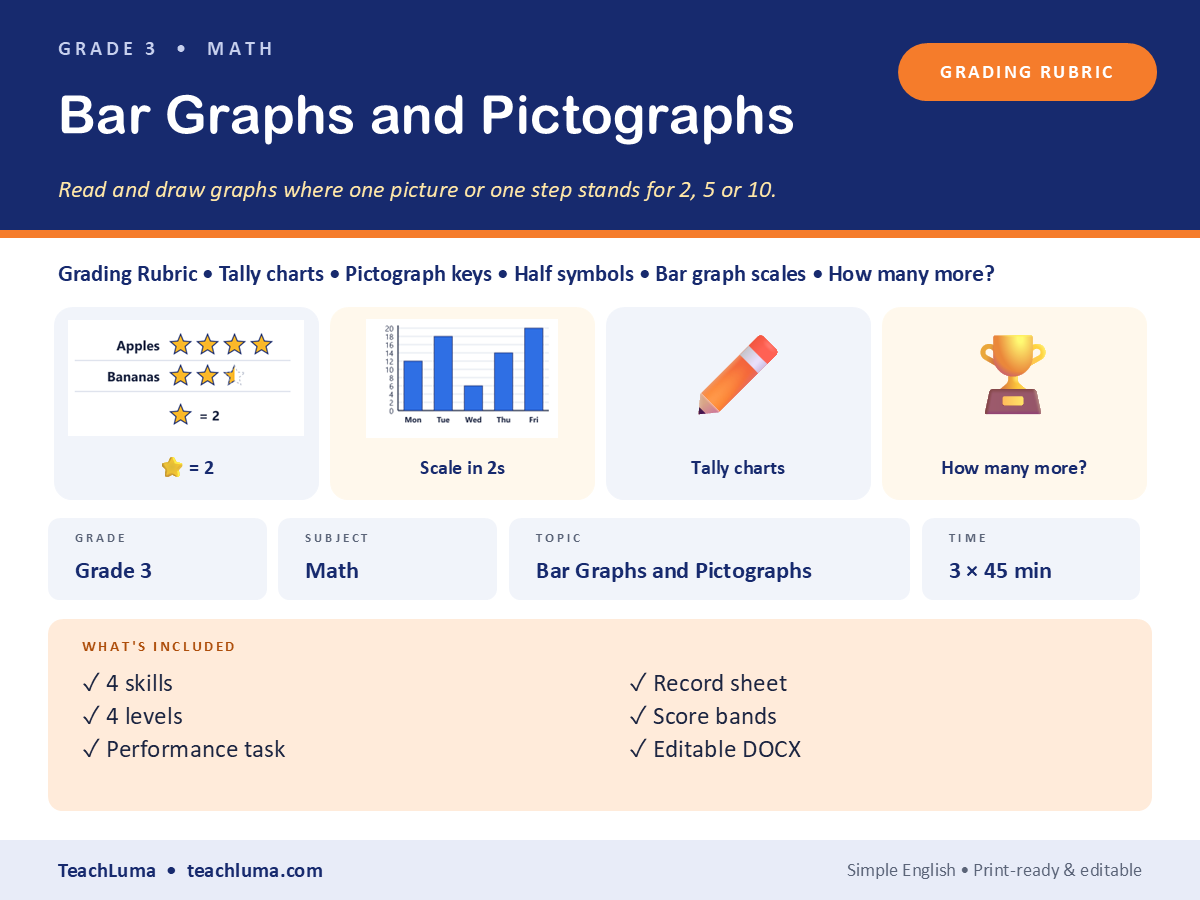
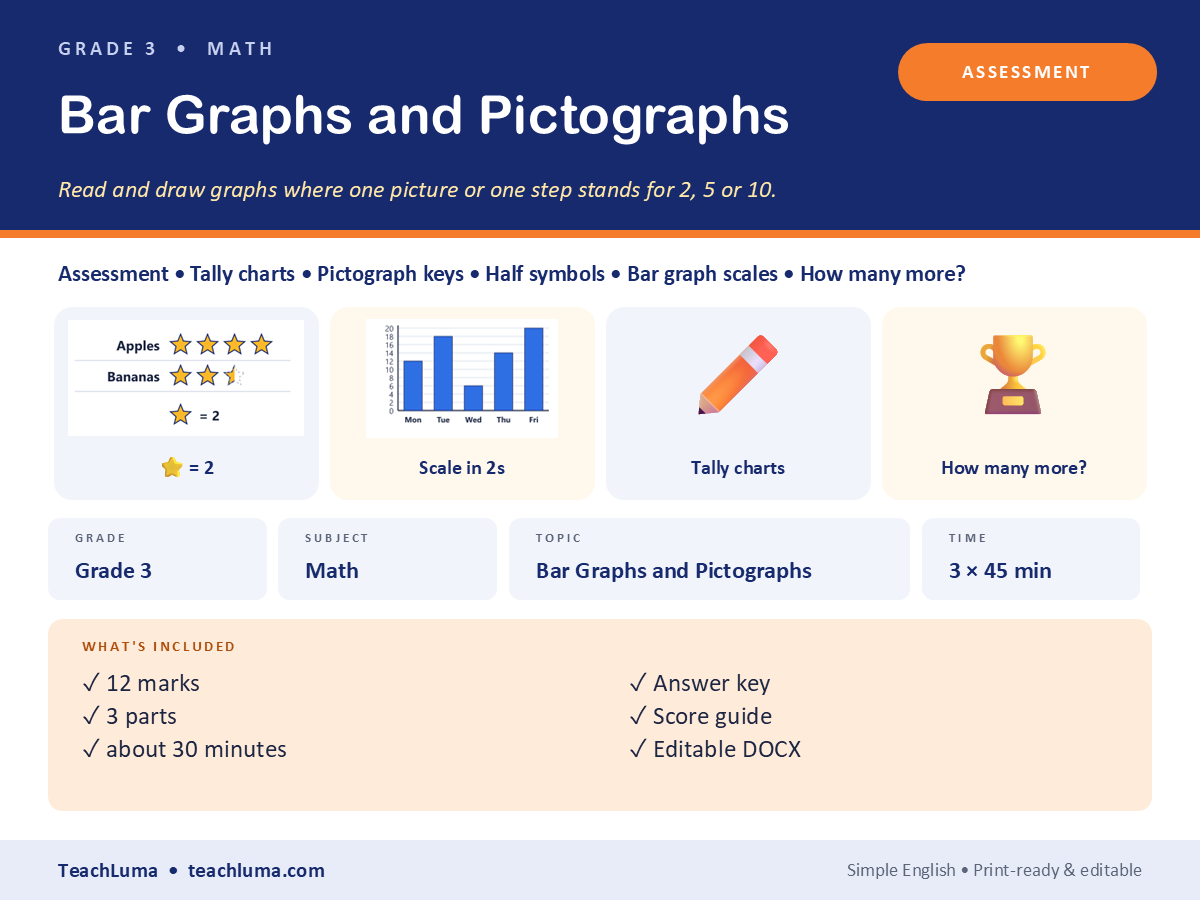
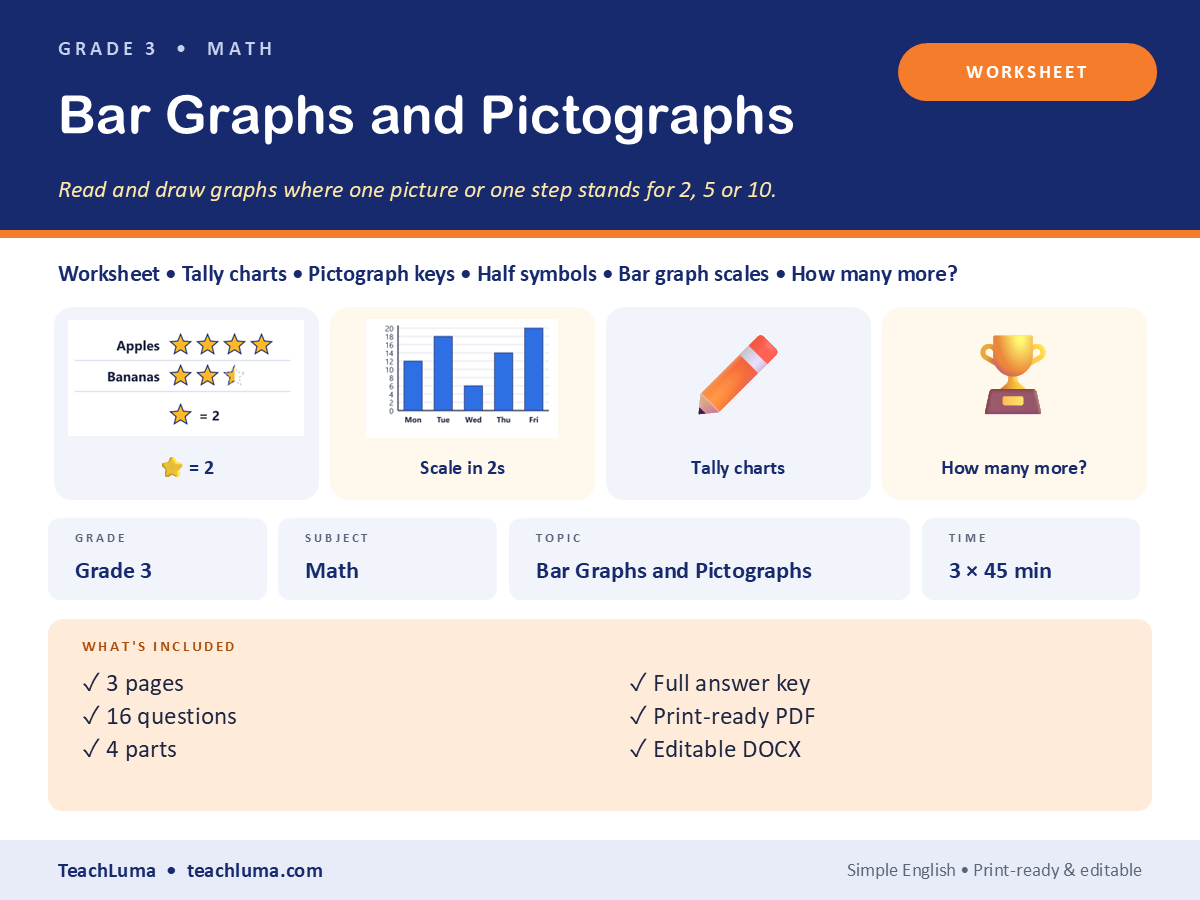
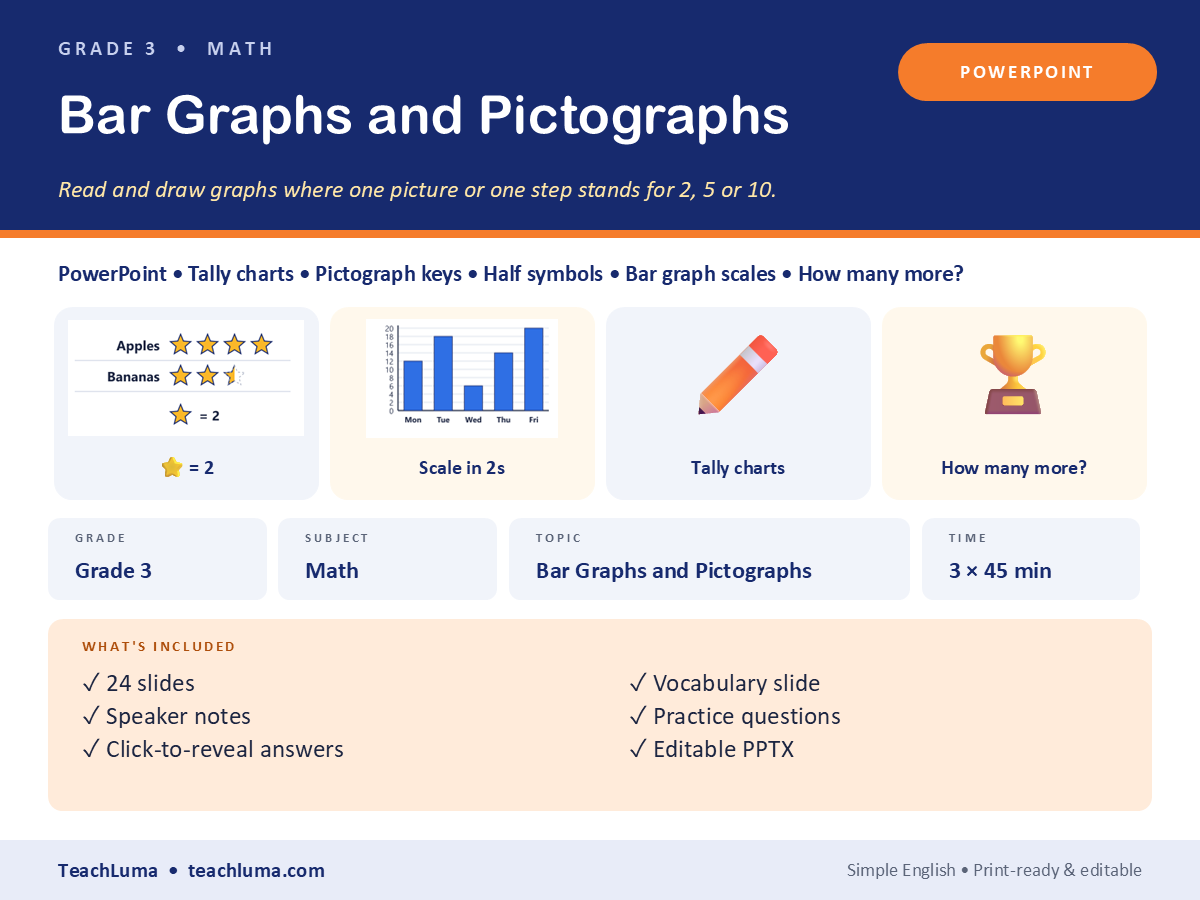
  • Read a pictograph where one symbol stands for 2, 5 or 10, including half symbols.
  • Read a bar graph with a scale that counts in 2s, 5s or 10s, including bars between gridlines.
  • Collect data in a tally chart and show it in a pictograph and a bar graph with a suitable scale.
  • Answer "how many more?", "how many fewer?" and "how many in total?" questions from graphs.

Differentiation

Support: Start with a key of 2 only; write the value next to each row. Challenge: Use a key of 10 with half symbols (= 5). English language learners: Teach question words: "How many…? How many more…? Which… the most?"

What's Included

  • Vocabulary cards: 6 cards
  • "What is it worth?" cards: 4 cards
  • Answer guide for matching and sorting

Additional Files


Teacher Reviews

No ratings yet

Be the first teacher to review this resource.

Sign in to review this resource.

Related Resources

Advertisement