Skip to content
Preview
Free Math Lesson Plan Grade 3
No ratings yet

Grade 3 Math Lesson Plan: Bar Graphs and Pictographs with Scales

About This Resource

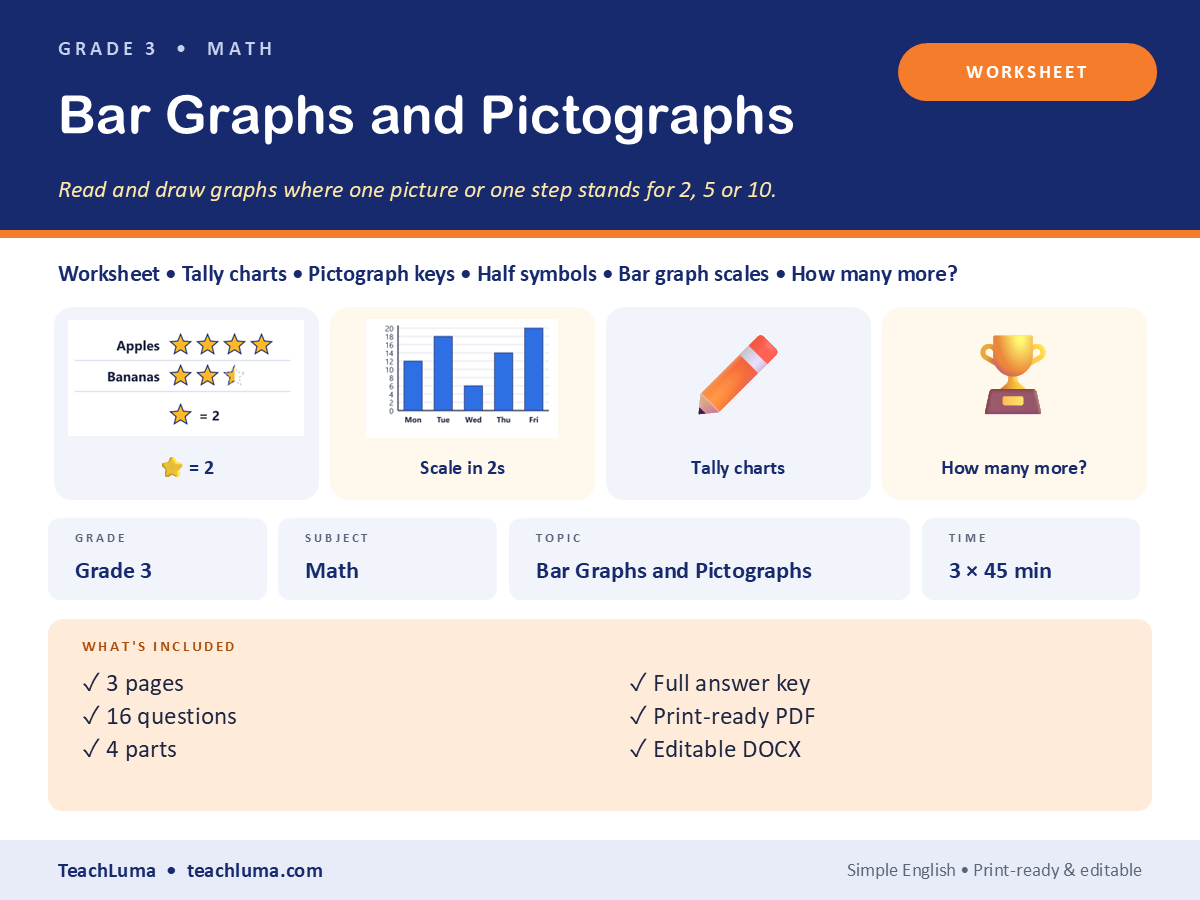
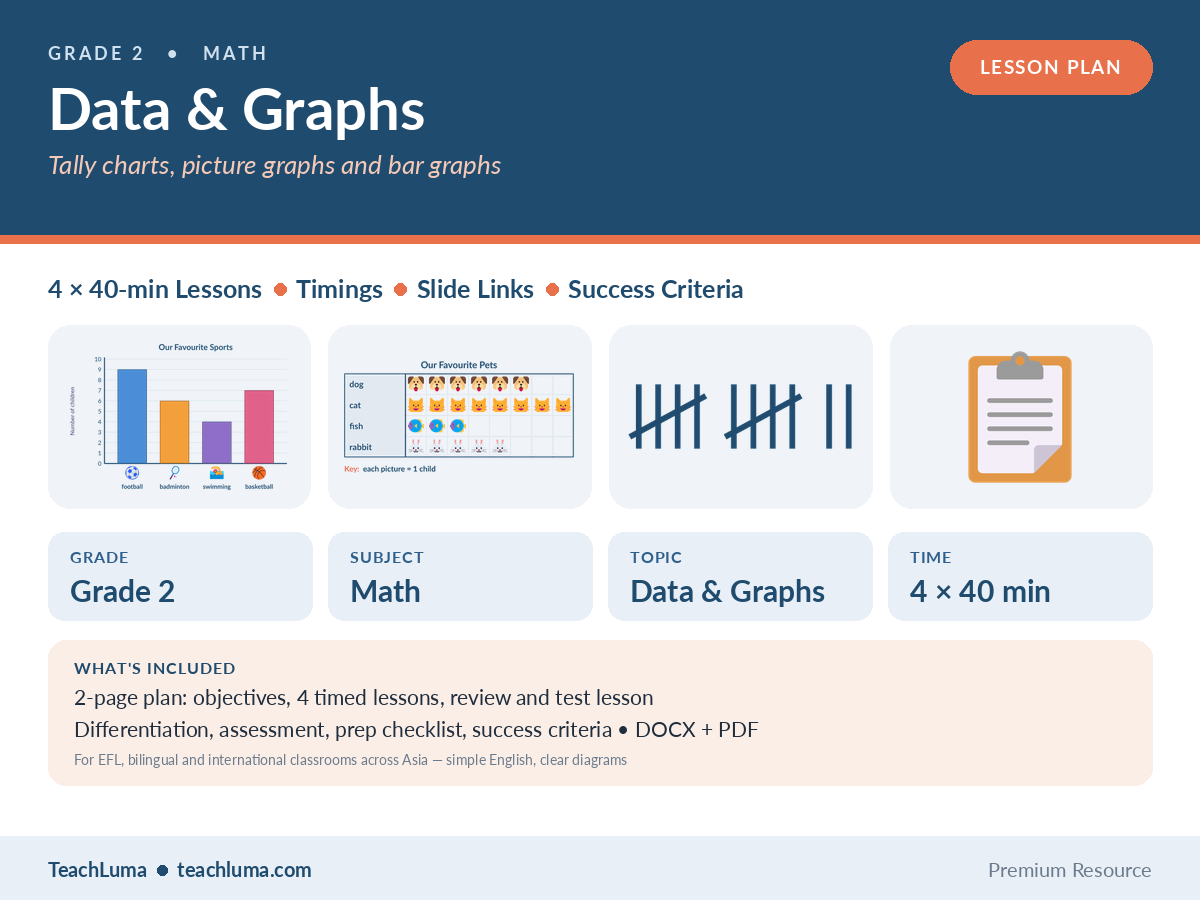
A 4-page, minute-by-minute plan for 3 lessons (3 lessons × 45 minutes) on bar graphs and pictographs: objectives, vocabulary, differentiation, misconceptions and teacher tips.

Resource Details

Subject
Math
Topic
Bar Graphs and Pictographs with Scales
Category
Data & Graphs
File Type
PDF
File Size
282.1 KB
Published
17 Oct 2026
Downloads
0
Download

Free download — no account required.

Teaching this in class? Try our free Random Name Picker & Timer.

Share:

Looking for something different? Request a Resource.


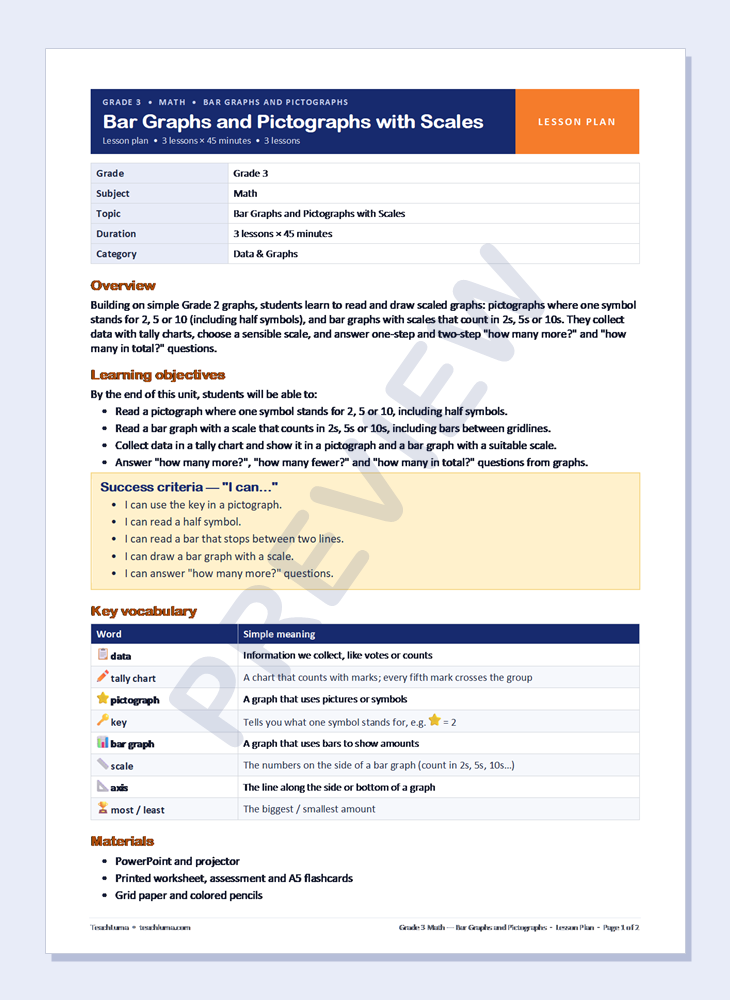
Learning Objectives

  • Read a pictograph where one symbol stands for 2, 5 or 10, including half symbols.
  • Read a bar graph with a scale that counts in 2s, 5s or 10s, including bars between gridlines.
  • Collect data in a tally chart and show it in a pictograph and a bar graph with a suitable scale.
  • Answer "how many more?", "how many fewer?" and "how many in total?" questions from graphs

Lesson Procedure

  • Lesson 1 — Pictographs with a key (45 min): follow the stage table (warm-up, teach, practice, exit ticket).
  • Lesson 2 — Bar graphs with scales (45 min): follow the stage table (warm-up, teach, practice, exit ticket).
  • Lesson 3 — Collect, draw and compare (45 min): follow the stage table (warm-up, teach, practice, exit ticket).
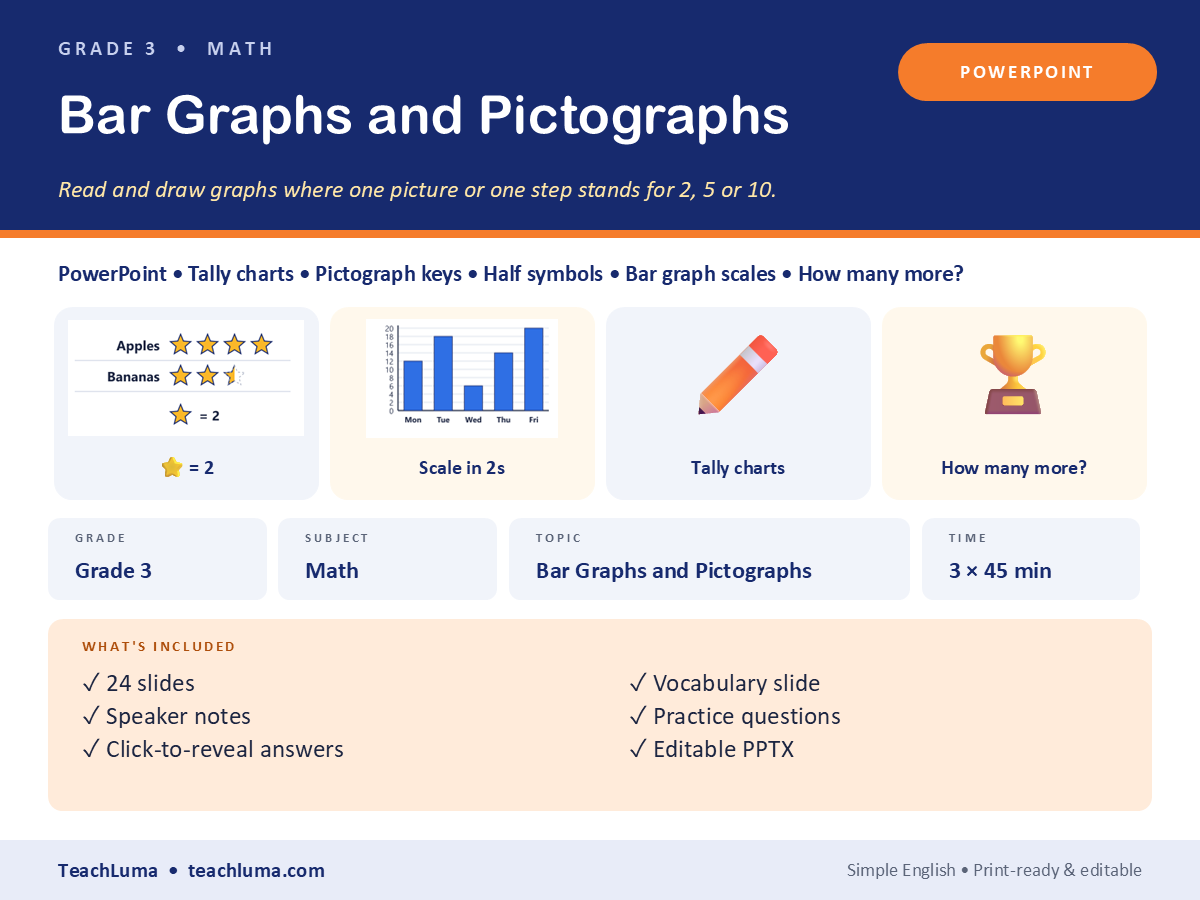
  • Use the matching PowerPoint, worksheet and assessment from this pack — the plan refers to their slide and part numbers.

Differentiation

Support: Start with a key of 2 only; write the value next to each row. Challenge: Use a key of 10 with half symbols (= 5). English language learners: Teach question words: "How many…? How many more…? Which… the most?"

Teacher Tips

Make graphs about real class data — students care more about the answers. Teach "key first, then count" as a routine.

What's Included

  • 4-page lesson plan (PDF + editable DOCX)
  • Lesson 1 — Pictographs with a key (45 min)
  • Lesson 2 — Bar graphs with scales (45 min)
  • Lesson 3 — Collect, draw and compare (45 min)
  • Key vocabulary table, materials list and success criteria
  • Differentiation (support, challenge, English language learners)
  • Common misconceptions with fixes, and teacher tips

Additional Files


Teacher Reviews

No ratings yet

Be the first teacher to review this resource.

Sign in to review this resource.

Related Resources

Advertisement