Skip to content
Preview
Members Only Math Worksheet Grade 1
No ratings yet

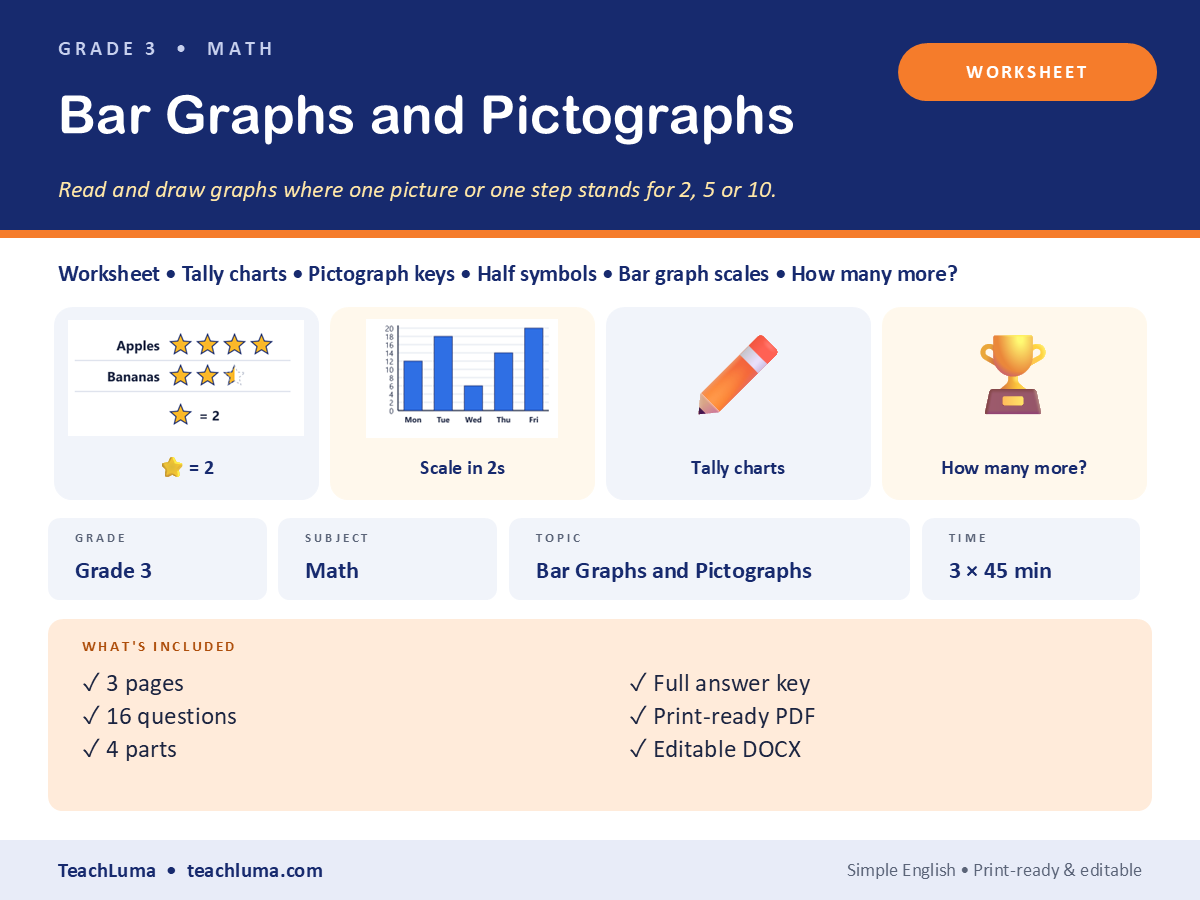
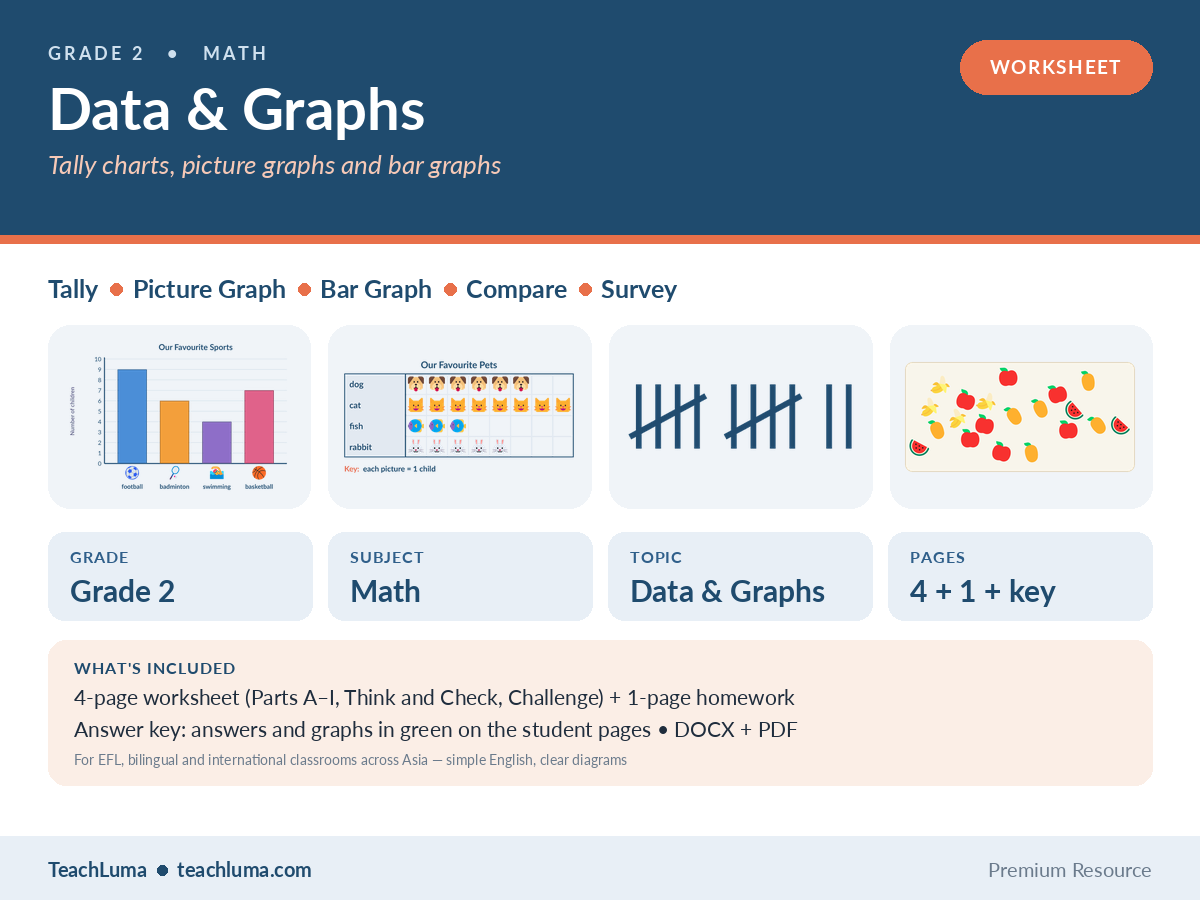
Picture Graphs: Count, Compare and Make Your Own

About This Resource

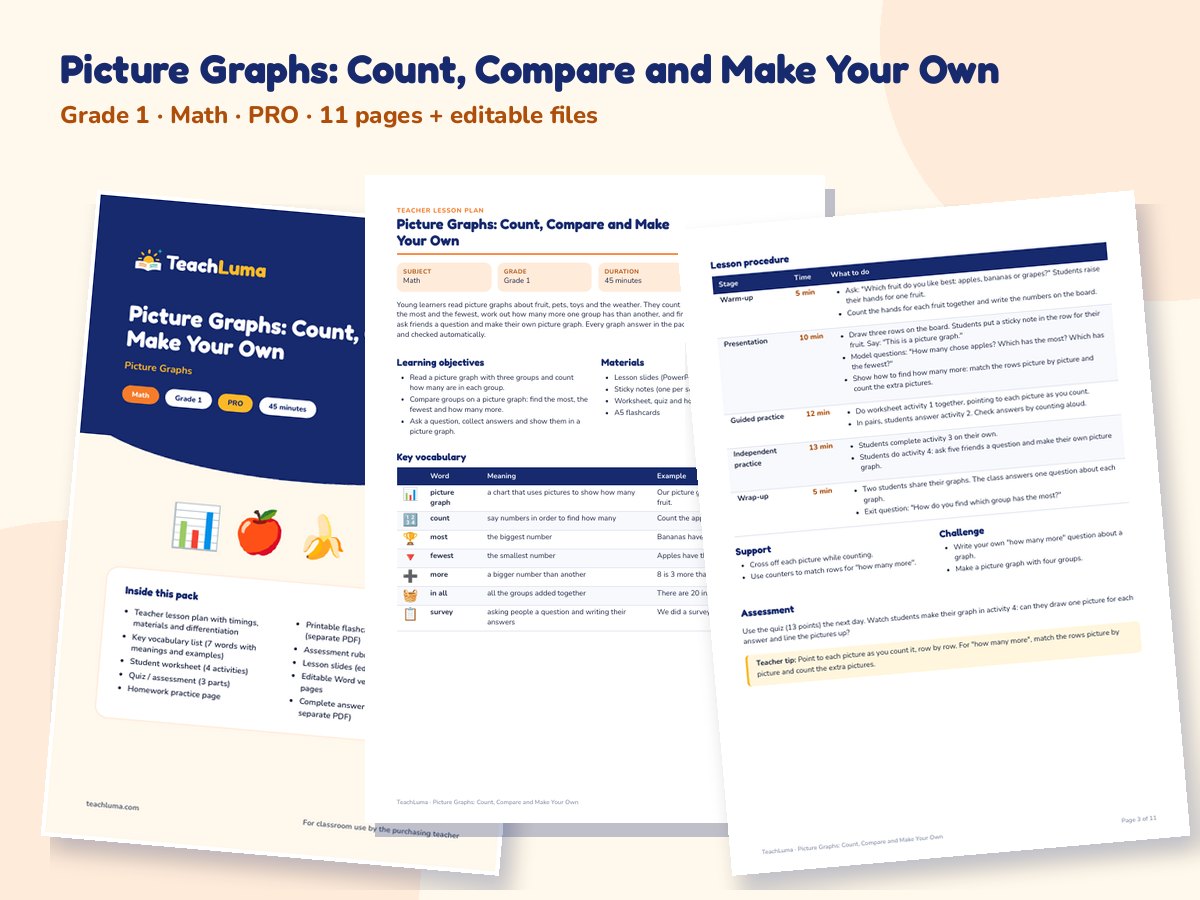
A complete Grade 1 data pack: reading picture graphs with three groups, counting, finding the most and fewest, comparing with how many more, and making a class picture graph. Includes a lesson plan, worksheet, quiz, homework, A5 flashcards, a rubric, editable slides and Word files, and answer keys.

Overview

Young learners read picture graphs about fruit, pets, toys and the weather. They count each group, find which group has the most and the fewest, work out how many more one group has than another, and find how many in all. Then they ask friends a question and make their own picture graph. Every graph answer in the pack is calculated by the generator and checked automatically.

Resource Details

Subject
Math
Topic
Picture Graphs
Category
Data & Graphs
File Type
PDF
File Size
430.6 KB
Published
28 Oct 2026
Downloads
0

Members Only

Upgrade to Teacher Pro (from ฿199/month) to download this resource.

Share:

Looking for something different? Request a Resource.


Grade 1 (ages 6–7) 45 minutes Counting comparing numbers reading graphs collecting data making graphs

Student Task

  • Teach the lesson with the slides: make a class picture graph together first.
  • Use the worksheet for guided and independent practice.
  • Give the quiz the next day and use the rubric to record progress.
  • Send the homework survey home and use the A5 flashcards to review the words.

Classroom Use

  • Sticky-note graph: each student puts a sticky note above their favorite fruit to build a real graph.
  • Graph walk: hang three graphs on the wall and let pairs answer one question at each.
  • Shoe graph: line up shoes by type (laces, straps, slip-on) and turn the lines into a picture graph.

Differentiation

Support: let students cross off each picture as they count it. Challenge: ask students to write their own "how many more" question for a partner.

Answer Key & Assessment

The quiz (13 points) checks reading, comparing and totals. The rubric gives four levels for counting, comparing, totals and making a graph.

Learning Objectives

  • Read a picture graph with three groups and count how many are in each group.
  • Compare groups on a picture graph: find the most, the fewest and how many more.
  • Ask a question, collect answers and show them in a picture graph.

Teacher Tips

Point to each picture as you count it, row by row. For "how many more", match the rows picture by picture and count the extra pictures.

What's Included

  • 11-page printable PDF lesson pack: teacher lesson plan with timings, materials and differentiation
  • Key vocabulary list (7 words with meanings and examples)
  • Student worksheet (4 activities)
  • Quiz / assessment (3 parts)
  • Homework practice page
  • Printable flashcards: 7 A5 picture cards (separate PDF)
  • Assessment rubric (4 levels)
  • Lesson slides (editable PowerPoint)
  • Editable Word version of all student pages
  • Complete answer key (also as a separate PDF)

Additional Files

  • Lesson Slides (PowerPoint, editable) (PPTX)
  • Editable Student Pages + Lesson Plan (Word) (DOCX)
  • Flashcards (PDF, A5, one card per page) (PDF)
  • Answer Key (PDF) (PDF)

Teacher Reviews

No ratings yet

Be the first teacher to review this resource.

Sign in to review this resource.

Related Resources

Advertisement