Skip to content
Preview
Members Only ESL Complete Lesson Pack Grade 9 (Year 10)
No ratings yet

Rising and Falling: Describing Graphs and Charts

About This Resource

A complete Grade 9 ESL writing pack on describing graphs and charts. Students learn trend language (rise, fall, peak, remain stable), adverbs of degree (sharply, slightly, steadily), comparison and proportion phrases (twice as many, the majority, a quarter), read a bar chart and a line graph, analyze a model description and write their own data report with an overview. Includes slides, a lesson plan, worksheet, quiz, homework, flashcards, a rubric and answer keys.

Overview

Describing data clearly is a key skill in science, geography and many exams. A good description starts by saying what the chart shows, gives an overview of the main trend or the biggest difference, and then supports it with specific numbers. Students learn verbs and nouns for change (increase, decrease, a rise, a drop), adverbs that show how much (sharply, slightly, steadily) and phrases for comparison and proportion (twice as many, half, the majority, a quarter). They work with two school-based data sets: how students travel to school (bar chart) and library visits over six months (line graph), analyze a model description and then write their own report.

Resource Details

Subject
ESL
Topic
Describing Graphs and Charts
Category
Writing
File Type
PDF
File Size
312.4 KB
Published
13 Nov 2026
Downloads
0

Members Only

Create a free account to download this resource with one of your 3 Free Pro Previews, or upgrade to Teacher Pro (from ฿199/month) for the whole library.

Share:

Looking for something different? Request a Resource.

Grade 9 ESL (ages 14–15), B1–B2 60 minutes Academic writing data interpretation vocabulary comparison

Learning Objectives

  • Use trend vocabulary and adverbs of degree to describe changes in data.
  • Use comparison and proportion phrases to describe bar charts.
  • Write a short report with an introduction, an overview and supporting figures.

How to Use This Resource

  • Show the slides: a simple line graph. Ask: "What happens to the line? How would you describe it in words?"
  • Read the data and the model description, then do worksheet activities 1 and 2 together.
  • Students complete activities 3 to 6, then use the quiz and send the homework page home.

Classroom Activity Ideas

  • Act the graph: students use arm movements to show rise sharply, fall slightly and remain stable.
  • Class survey: students collect real data from classmates and write a description.
  • Describe and draw: one student describes a graph; a partner draws it without looking.

Differentiation

Support: give a phrase bank sorted into up, down and no change, and a paragraph frame. Challenge: students compare two data sets in one report and explain possible reasons for the trends.

Assessment

Use the worksheet and quiz to check vocabulary and interpretation. Use the rubric to assess the written report.

Teacher Tips

Students often list every number without a summary. Insist on an overview sentence (Overall, …) that gives the big picture before the details. Remind students to use the past tense for data from the past and to check the units and labels on each chart.

What's Included

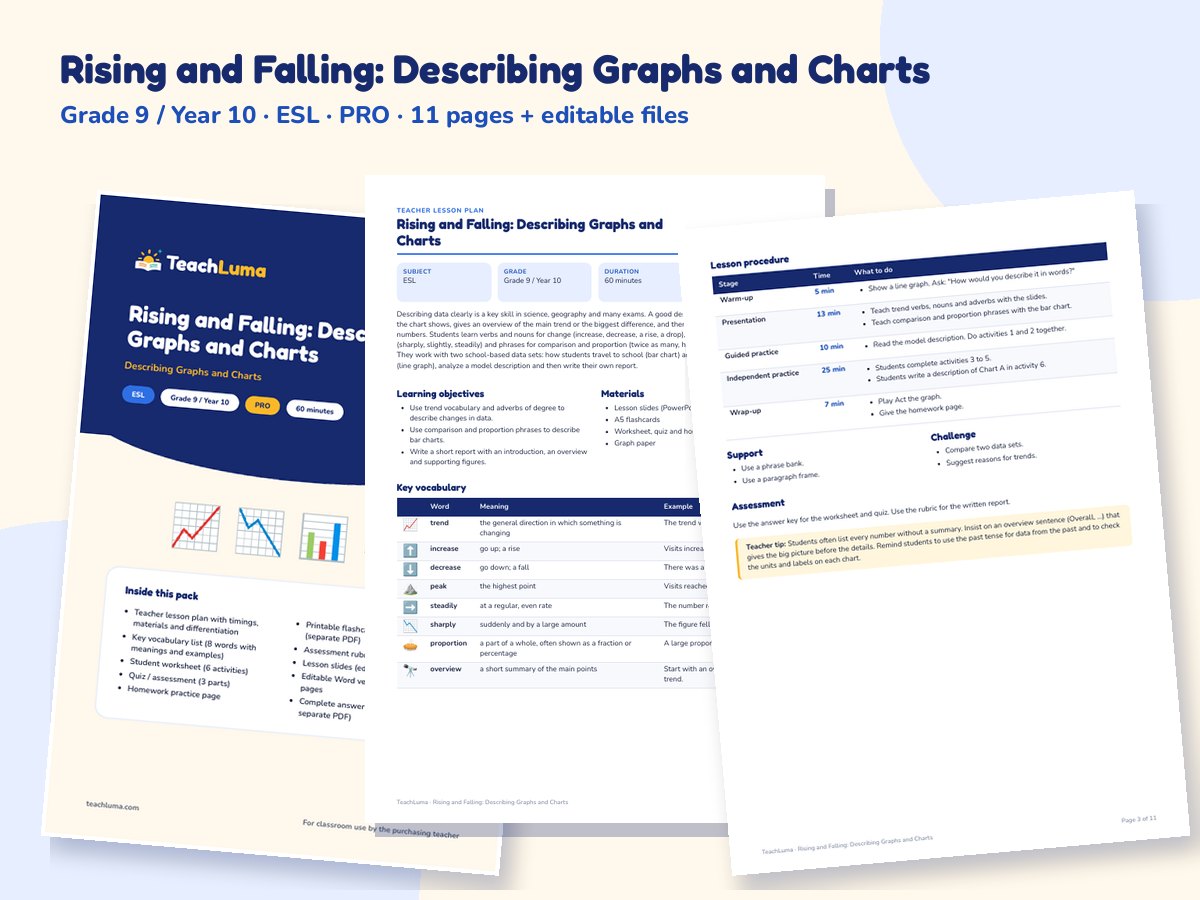
  • 11-page printable PDF lesson pack: teacher lesson plan with timings, materials and differentiation
  • Key vocabulary list (8 words with meanings and examples)
  • Student worksheet (6 activities)
  • Quiz / assessment (3 parts)
  • Homework practice page
  • Printable flashcards: 8 A5 picture cards (separate PDF)
  • Assessment rubric (4 levels)
  • Lesson slides (editable PowerPoint)
  • Editable Word version of all student pages
  • Complete answer key (also as a separate PDF)

Additional Files

  • Lesson Slides (PPTX)
  • Editable Student Pages and Lesson Plan (DOCX)
  • A5 Flashcards (PDF)
  • Answer Key (PDF)

Teacher Reviews

No ratings yet

Be the first teacher to review this resource.

Sign in to review this resource.

Related Resources

Advertisement