Line Plots with Fractions: Read, Make and Solve
A free Grade 5 lesson and worksheet on line plots with fractions: reading line plots marke...
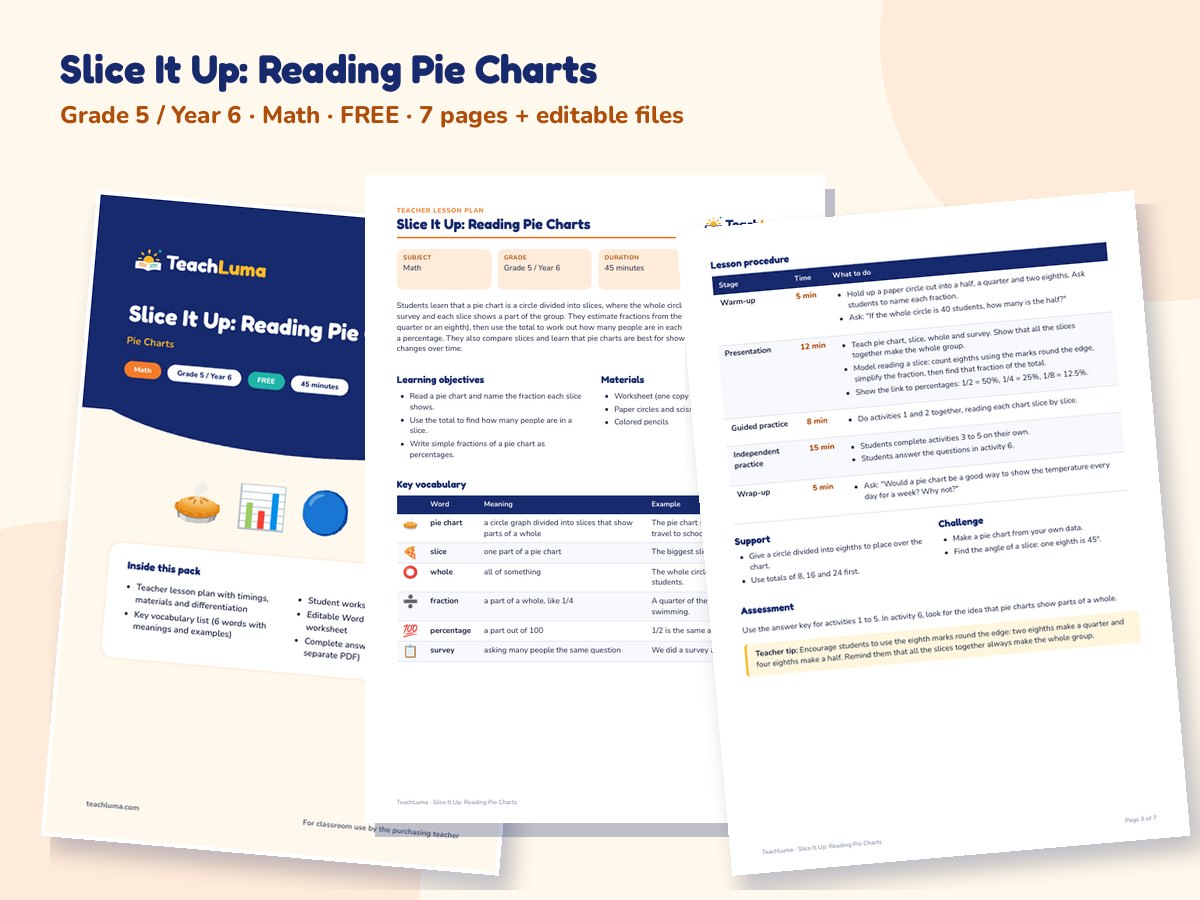
View Resource : Line Plots with Fractions: Read, Make and SolveA free Grade 5 math worksheet on reading pie charts: the whole circle stands for the whole group, and each slice shows a fraction of it. Students read halves, quarters and eighths from two pie charts, turn fractions into numbers of people and into percentages, compare slices, choose when a pie chart is the right graph and explain their answers. Includes a timed lesson plan, a six-activity worksheet, an editable Word version and answer key.
Students learn that a pie chart is a circle divided into slices, where the whole circle stands for everyone in the survey and each slice shows a part of the group. They estimate fractions from the size of each slice (a half, a quarter or an eighth), then use the total to work out how many people are in each slice, and write the fraction as a percentage. They also compare slices and learn that pie charts are best for showing parts of a whole, not changes over time.
Free download — no account required.
Teaching this in class? Try our free Random Name Picker & Timer.
Looking for something different? Request a Resource.
Support: give students a circle divided into eighths to place over the chart and count. Challenge: students make their own pie chart from data with a total of 24 and write three questions for a partner.
Activities 1 to 5 check reading fractions, numbers and percentages from pie charts (answer key included). Activity 6 shows whether students can explain when a pie chart is the right choice.
Encourage students to use the eighth marks round the edge: two eighths make a quarter and four eighths make a half. Remind them that all the slices together always make the whole group.
No ratings yet
Be the first teacher to review this resource.
A free Grade 5 lesson and worksheet on line plots with fractions: reading line plots marke...
View Resource : Line Plots with Fractions: Read, Make and SolveA free Grade 6 math worksheet on the probability scale from 0 (impossible) to 1 (certain),...
View Resource : How Likely Is It? The Probability Scale from 0 to 1A complete Grade 1 data pack: reading picture graphs with three groups, counting, finding ...
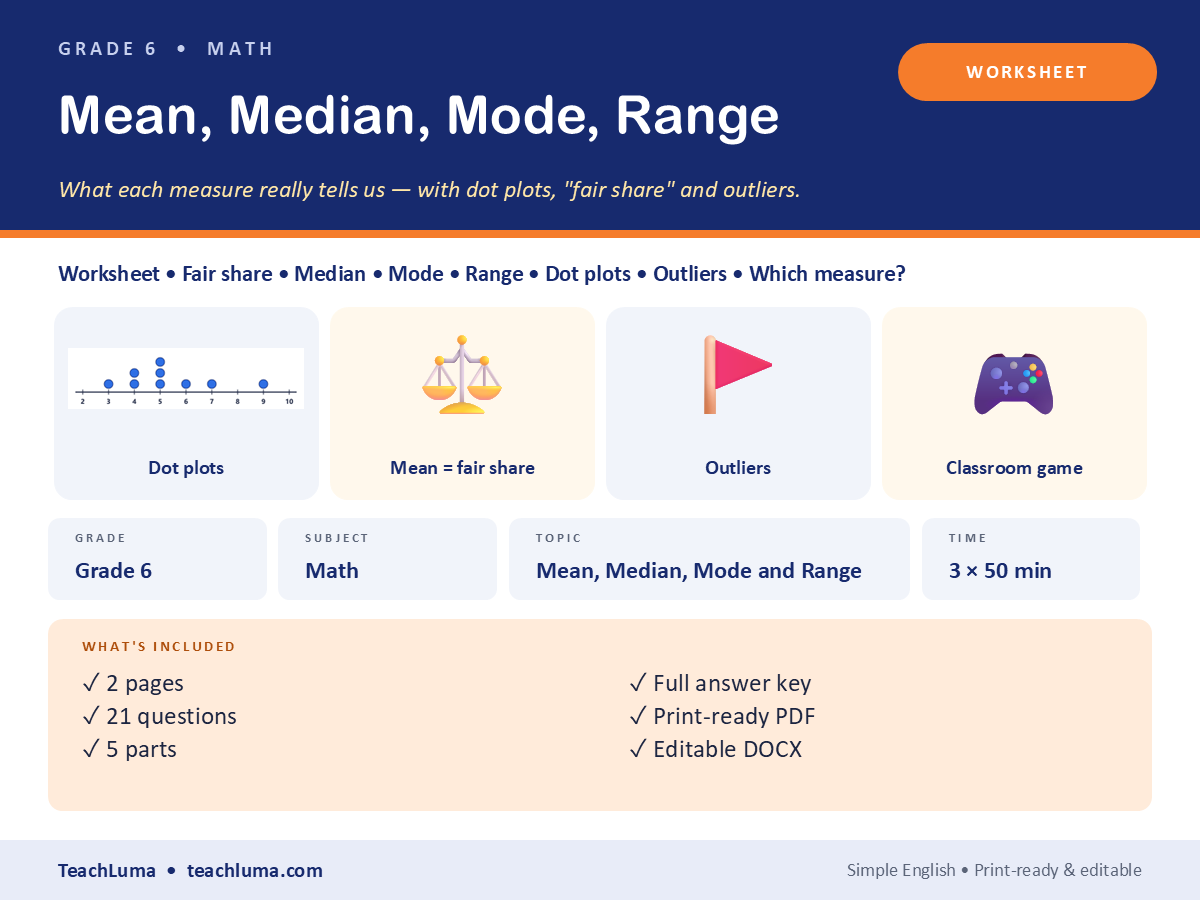
View Resource : Picture Graphs: Count, Compare and Make Your OwnA 2-page worksheet with 21 questions in 5 parts — mean as a fair share, all four measures,...
View Resource : Grade 6 Math Worksheet: Mean, Median, Mode and Range — Mean as a Fair Share, All Four Measures, Dot Plot, Outliers, Problem SolvingA 3-page worksheet with 16 questions in 4 parts — read the pictograph, read the bar graph,...
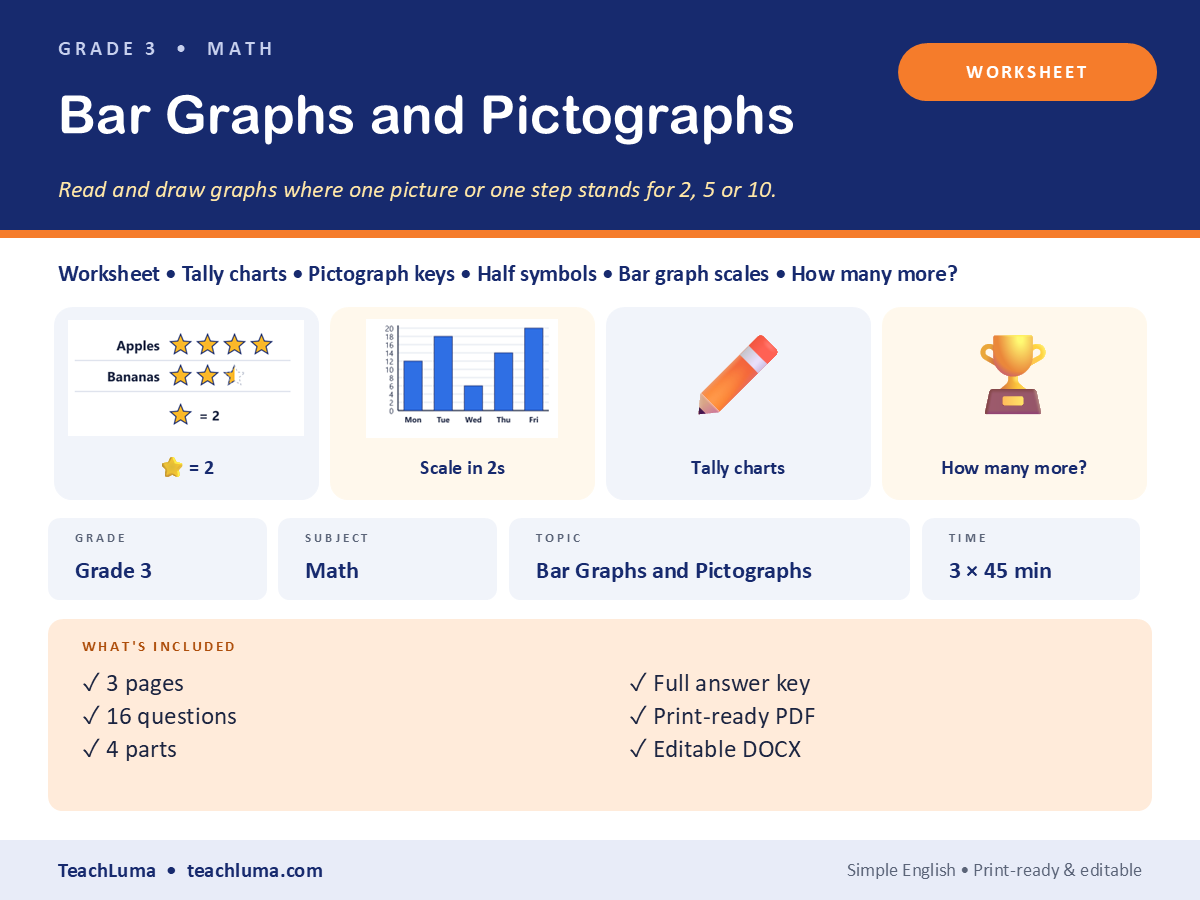
View Resource : Grade 3 Math Worksheet: Bar Graphs and Pictographs — Read the Pictograph, Read the Bar Graph, Tally Chart, Draw a Bar GraphA 4-page worksheet in 9 parts — sort and count, tally marks, make a tally chart, read a pi...
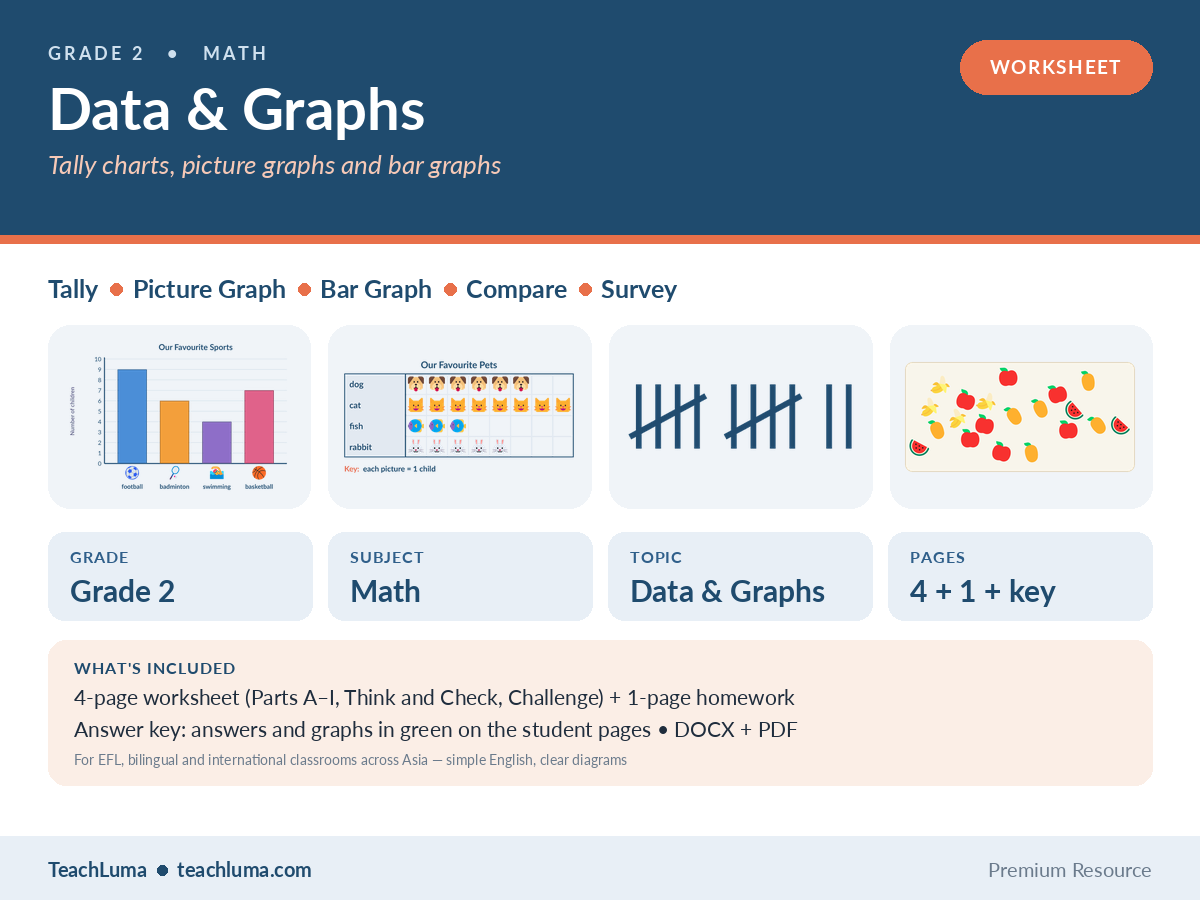
View Resource : Grade 2 Math Worksheet: Data & Graphs — Sort and Count, Tally Charts, Picture Graphs, Bar Graphs and Graph ProblemsAdvertisement