Picture Graphs: Count, Compare and Make Your Own
A complete Grade 1 data pack: reading picture graphs with three groups, counting, finding ...
View Resource : Picture Graphs: Count, Compare and Make Your OwnA free Grade 5 lesson and worksheet on line plots with fractions: reading line plots marked in eighths, counting data, finding totals and differences, equivalent fractions and making your own line plot. Includes a timed lesson plan, worksheet, editable Word version and answer key.
Students read line plots that show measurements in fractions of a unit (ribbon lengths and water in bottles), where each X stands for one measurement. They count how many items have a value, find the most common value, add the measurements at one value, and find the difference between the longest and shortest. Then they make their own line plot from a data set in quarters and use it to solve problems. Every line plot question is generated and checked automatically.
Free download — no account required.
Teaching this in class? Try our free Random Name Picker & Timer.
Looking for something different? Request a Resource.
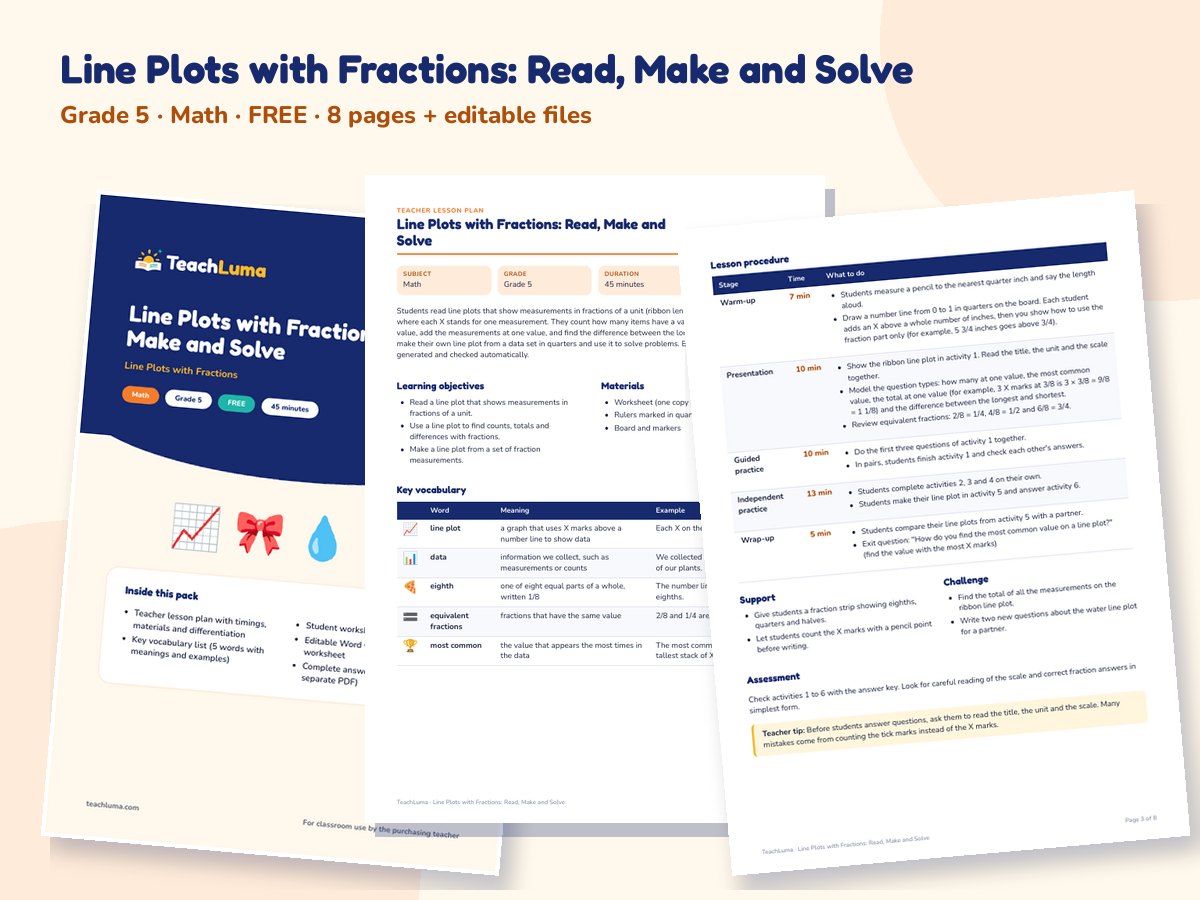
Support: give students a fraction strip showing eighths, quarters and halves so they can see that 2/8 = 1/4 and 4/8 = 1/2. Challenge: ask students to find the total of all the measurements on the line plot.
Activities 1 and 2 check reading line plots; activities 3 and 4 check fraction reasoning; activities 5 and 6 check making and using a line plot (answer key included).
Before students answer questions, ask them to read the title, the unit and the scale. Many mistakes come from counting the tick marks instead of the X marks.
No ratings yet
Be the first teacher to review this resource.
A complete Grade 1 data pack: reading picture graphs with three groups, counting, finding ...
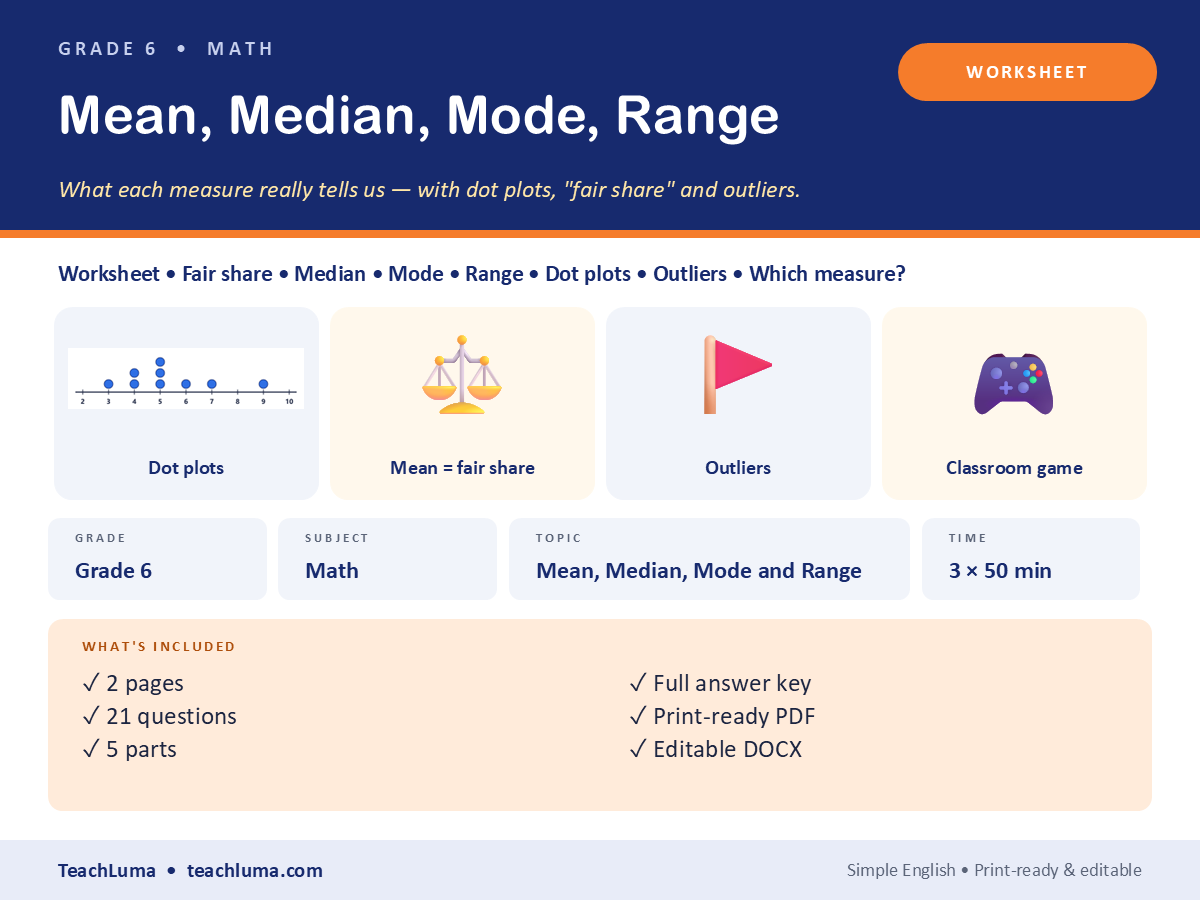
View Resource : Picture Graphs: Count, Compare and Make Your OwnA 2-page worksheet with 21 questions in 5 parts — mean as a fair share, all four measures,...
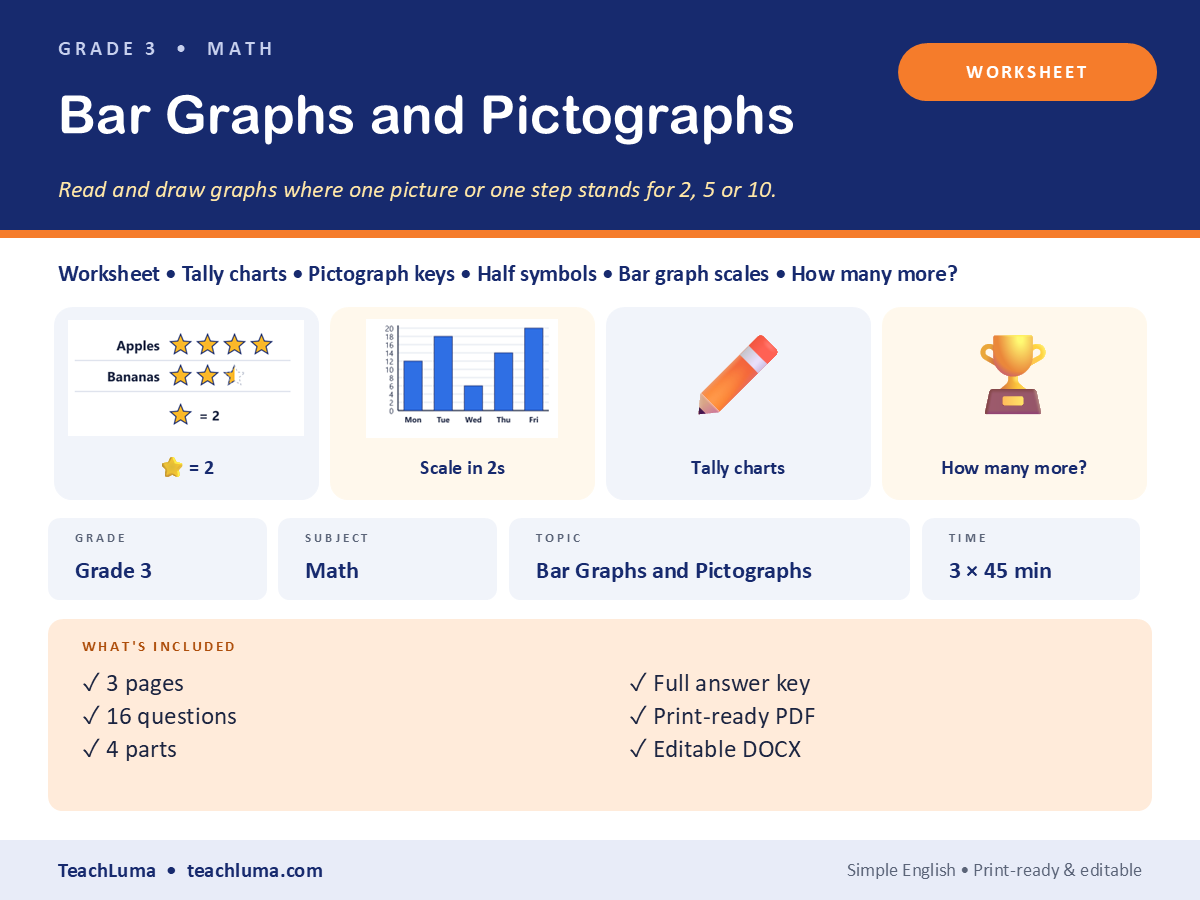
View Resource : Grade 6 Math Worksheet: Mean, Median, Mode and Range — Mean as a Fair Share, All Four Measures, Dot Plot, Outliers, Problem SolvingA 3-page worksheet with 16 questions in 4 parts — read the pictograph, read the bar graph,...
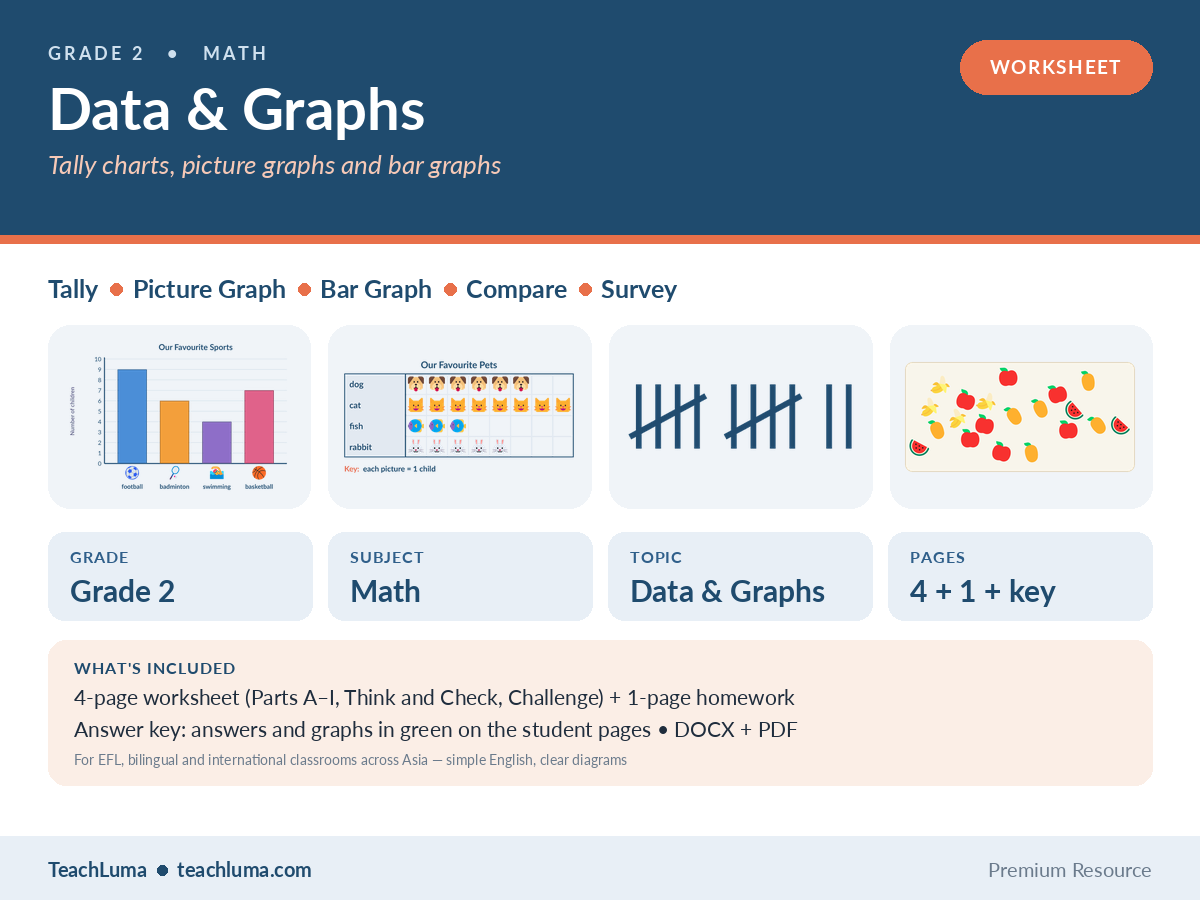
View Resource : Grade 3 Math Worksheet: Bar Graphs and Pictographs — Read the Pictograph, Read the Bar Graph, Tally Chart, Draw a Bar GraphA 4-page worksheet in 9 parts — sort and count, tally marks, make a tally chart, read a pi...
View Resource : Grade 2 Math Worksheet: Data & Graphs — Sort and Count, Tally Charts, Picture Graphs, Bar Graphs and Graph ProblemsA complete Grade 5 pack on dividing 3- and 4-digit numbers by 2-digit divisors: estimating...
View Resource : Long Division: Dividing by Two-Digit NumbersA complete Grade 5 order of operations pack: brackets first, then multiplication and divis...
View Resource : Order of Operations: Brackets, Multiply and Divide, Add and SubtractAdvertisement